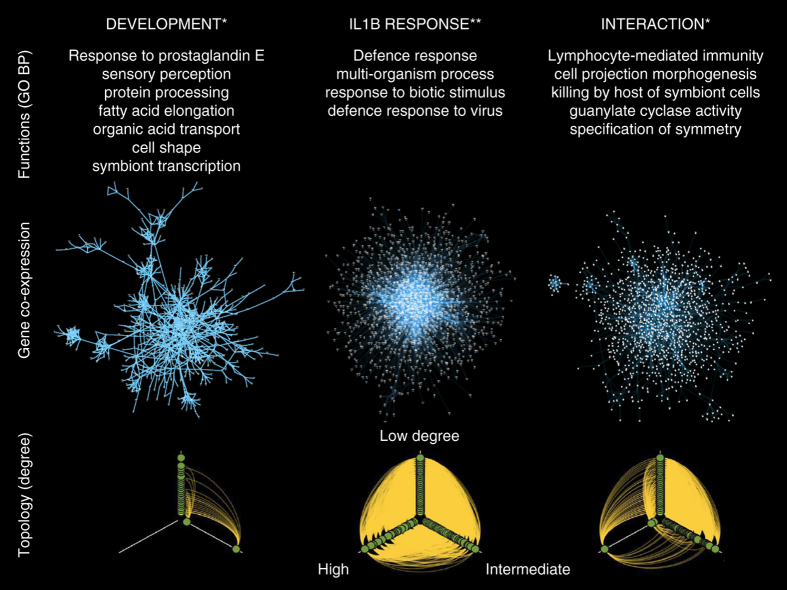
Fig. 2.
Gene co-expression networks for three responses. Development, IL1B and interaction. Top: summary of functional annotation. Hypergeometric test, * = nominal p < 0.05, ** = adjusted p < 0.05. Middle: Gene co-expression networks; nodes = genes, edges = partial correlations, local FDR = 1x10⁻¹³. Bottom: Hiveplots for each network illustrating differences in topology between responses, where nodes are arranged on axes according to their degree; axes range clockwise from top: degree < 30, 30 ≤ degree ≤ 80, degree x > 80

