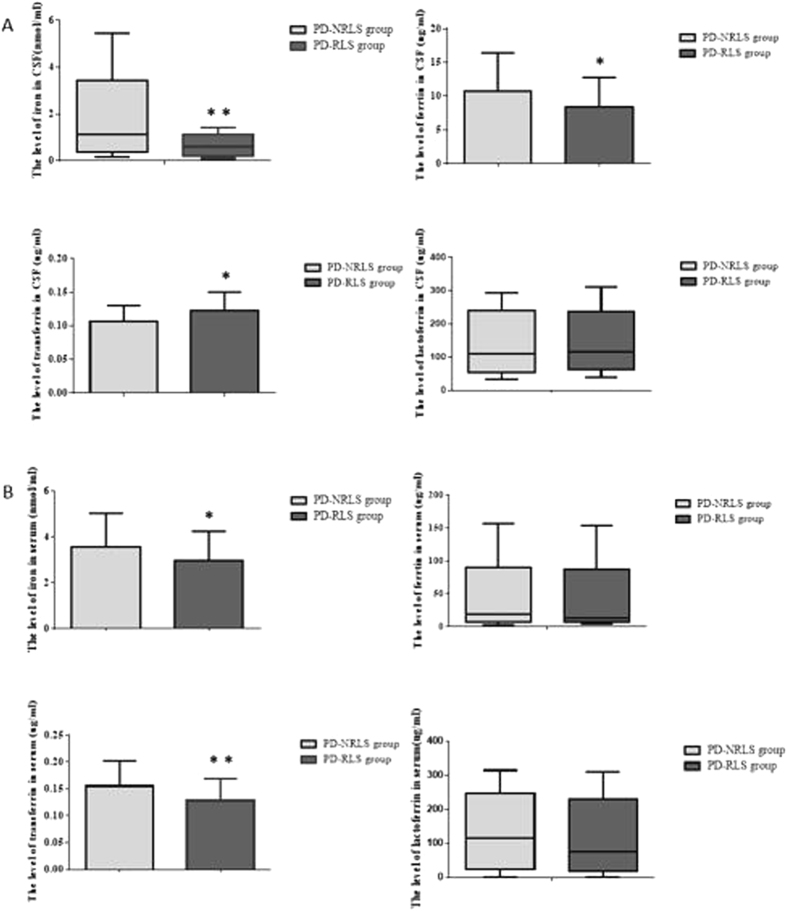
Figure 1.
The levels of iron and related proteins in CSF (Fig. 1A) and serum (Fig. 1B) in PD-RLS and PD-NRLS groups. Two-tailed t test was used for the comparison of the levels of ferrtin and transferrin in CSF as well as iron and transferrin in serum between PD-RLS and PD-NRLS groups; Nonparametric test was used for the comparison of levels of iron and lactoferrin in CSF as well as ferritin and lactoferrin in serum between PD-RLS and PD-NRLS groups. *P < 0.05, **P < 0.01.

