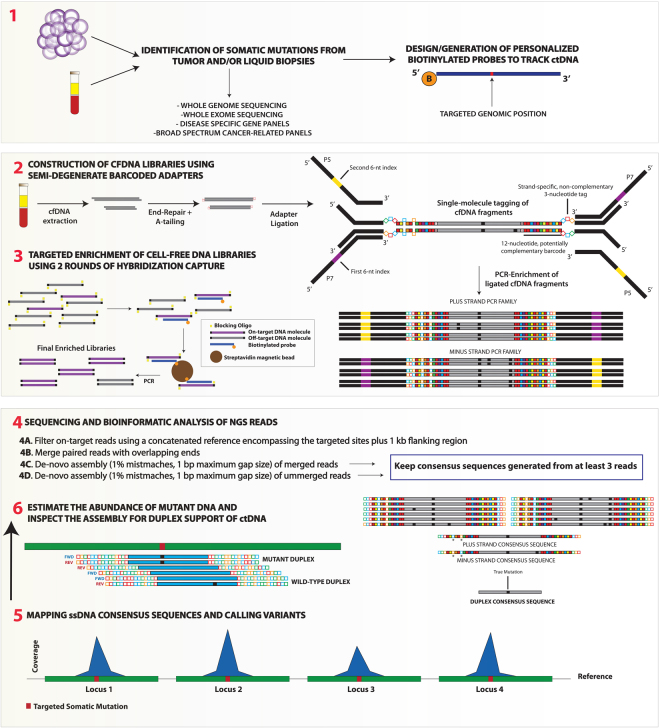
Figure 1.
Overview of the experimental workflow to track ctDNA in cancer patients using semi-degenerate barcoded adapters and personalized panels of biotinylated baits. Biotinylated baits targeting somatic mutations previously identified via the sequencing of tumor/liquid biopsies and matched normal DNA samples are generated “in-house” or ordered from commercial manufacturers (1). Next, libraries are built using the cfDNA isolated from liquid biopsy specimens (2). End-repaired and A-tailed cfDNA fragments are ligated with partially complementary double-stranded barcoded adapters and then PCR-amplified with 6-nucleotide dual-indexed primers that provide P5 and P7 Illumina adapter sequences. Our custom adapters are comprised of the annealing of two oligonucleotides that harbor non-complementary tri-nucleotide tags for either the plus (5′–3′) or the minus (3′–5′) strand. Different nucleotides within the fixed tags are represented by colours (A:red; C:blue; T:green; G:orange). This adapter design also includes a semi-degenerate and potentially complementary 12-nucleotide barcode sequence ((5′-WSMRWSYWKMWW-3′) in plus strand; (5′-WWKMWRSWYKSW-3′) in minus strand)). During the annealing of the two oligonucleotides a perfect complementary match can occur (right adapter) but, more commonly, hybridizations include annealing mispairings (left adapter). Solid red squares represent either A-T or T-A base pairings (W vs W); solid yellow squares represent either G-C or C-G base pairings (S vs S); solid blue squares represent either C-G or A-T base pairings (M vs K); orange squares represent G-C or A-T (R vs Y); solid green squares represent C-G or T-A base pairings (Y vs R) and solid violet squares represent G-C or T-A base pairings (K vs M). Annealing mispairings (see left adapter) are denoted by the presence of the same base at equivalent positions in both strands. Libraries are then subjected to two rounds (ideally) of hybridization capture using personalized panels of biotinylated baits and final enriched libraries are sequenced on Illumina platforms (3). The bioinformatic analysis of the NGS reads involves the filtering of on-target reads, merging of paired reads with overlapping ends and generation of consensus sequences according to a de-novo assembly approach that allows for a maximum of 1% mismatches and maximum gap size of 1 bp (4). In essence, the two parental strands derived from every single cfDNA molecule generate independent PCR families. Consensus sequences are generated from each PCR family with at least three independent reads. Consensus sequences from independent strand orientations are considered to derive from the same cfDNA molecule if they share the same start/end positions in the reference sequence and if they do not show more than 2 mismatches in the last 6 semi-degenerate barcode positions flanking the ligation site. Duplex sequencing allows correcting any strand-specific errors or variants deriving from DNA damage. After sequencing, solid red squares represent W degenerate positions (i.e. either A or T); solid yellow squares = S; solid blue squares = M; solid orange squares = R; solid green squares = Y; solid violate squares = K). Annealing mismatches are denoted by white squares and indicated by asterisks. Black squares represent discrepancies with respect to the reference sequence. Consensus sequences are finally mapped against the reference sequence (5) and targeted genomic positions are screened for duplex support of ctDNA and its abundance (6) Only variants independently supported by the consensus sequences of both parental strands are considered high-confidence.

