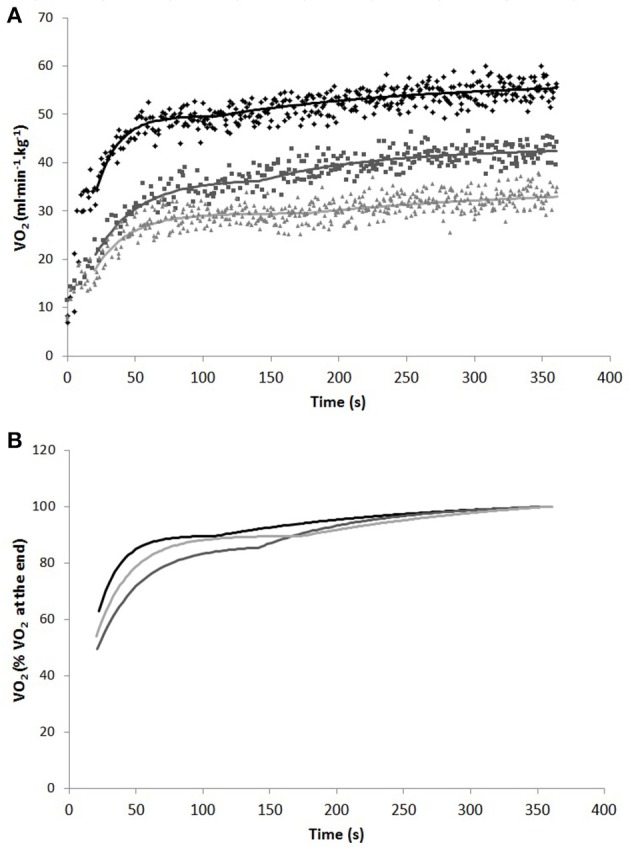
Figure 2.

Representative breath-by-breath and best fit O2 kinetics curves in weight-related O2 values (A) and best fit O2 kinetics curves in percentage of O2 at the end of the exercise (B) in one subject during cycling (black), swimming (dark gray), and arm cranking (light gray). To remove the influence of the cardiodynamic phase on the subsequent response, the first 20 s of data were excluded from the analysis.
