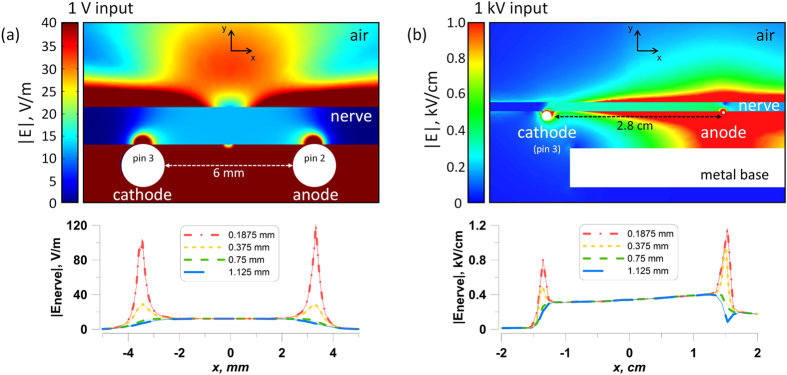
Figure 3.
Electric field simulation results for conventional (a) and nsPEF (b) stimulation of the isolated nerve. Upper panels show the electric field distribution in a plane crossing the nerve perpendicular to stimulating electrodes. Note different values of the voltage input and different units for the electric field strength (1 V and V/m in a; 1 kV and kV/cm in b). Lower panels show the electric field values in the same plane, at four indicated depths into the nerve. For both conventional and nsPEF stimuli, action potentials in the nerve will be elicited at the cathode (pin 3). The electric field values reported elsewhere in this paper are the maximum values found over the cathode at the depth of 0.1875 mm into the nerve. See text for more details.

