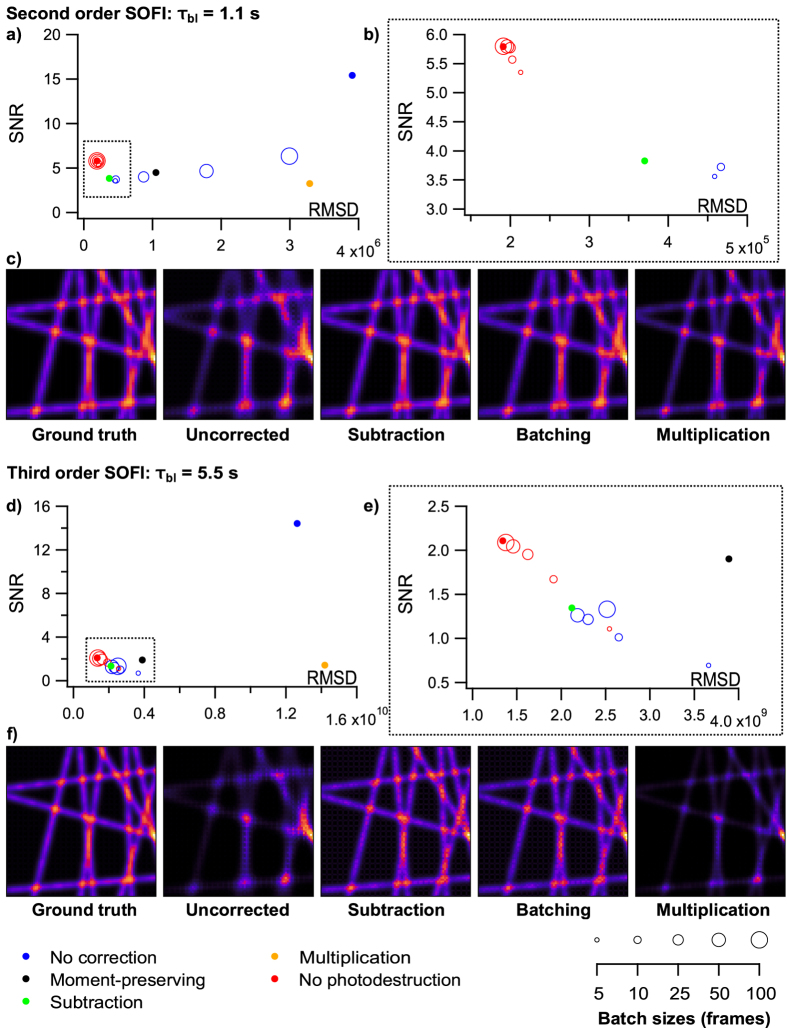
Figure 4.
Evaluation of different photodestruction-correcting methods on simulated data. (a) 2nd order SOFI with fluorophores assigned a τ bl value of 1.1 s. Batch sizes of 100, 50, 25, 10, and 5 frames were examined and are visualized by different marker sizes. (b) Close-up of the region in dotted box in (a). (c) Images of certain datasets to serve as a visual reference for RMSD values. (d–f) correspond to (a–c) respectively for 3rd order simulations with a τ bl value of 5.5 s. All images are averaged SOFI images of 100 repetitions. A batch size of 25 was used to generate the batching corrected image.

