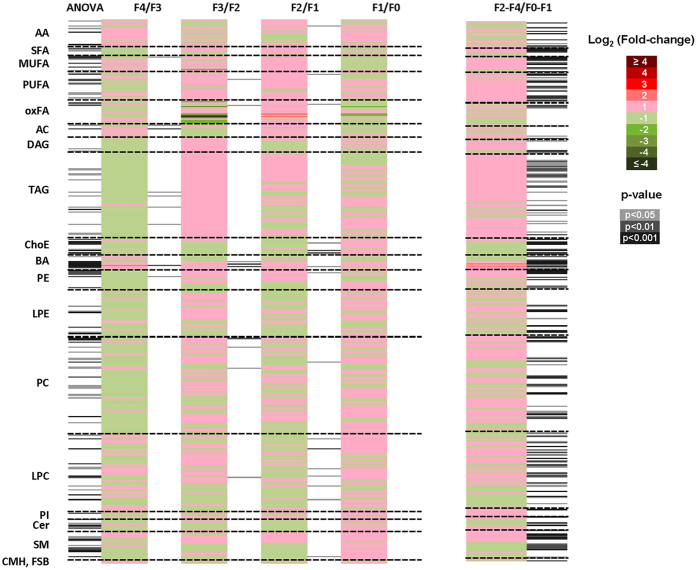
Figure 4.
Metabolomics signature in the serum of transplanted patients with HCV. Heatmaps represent fold-changes and p-values derived from the comparison of the relative metabolite levels in serum samples among all fibrosis stage (ANOVA) and between a specific fibrosis degree and its immediate lower fibrosis degree (Tukey’s post hoc test) (i.e., F4/F3, F3/F2, F2/F1, and F1/F0). Rapid (F2-F4; n = 69) were compared with slow (F0-F1; n = 134) fibrosers with unpaired Student’s t test (or Welch’s t test where unequal variances were found). For each comparison, log transformed ion abundance ratios are depicted, as represented by the scale. Darker green and red colours indicate higher drops or elevations of the metabolite levels, respectively. Grey lines correspond to significant fold-changes of individual metabolite levels, darker grey colours have been used to stress higher significances (p < 0.05, p < 0.01 or p < 0.001). It is relevant to highlight that lipid metabolites present in this picture have been ordered according to the carbon number and unsaturation degree of their acyl chains. Data represented in the figure is detailed in Supplementary Table S1.

