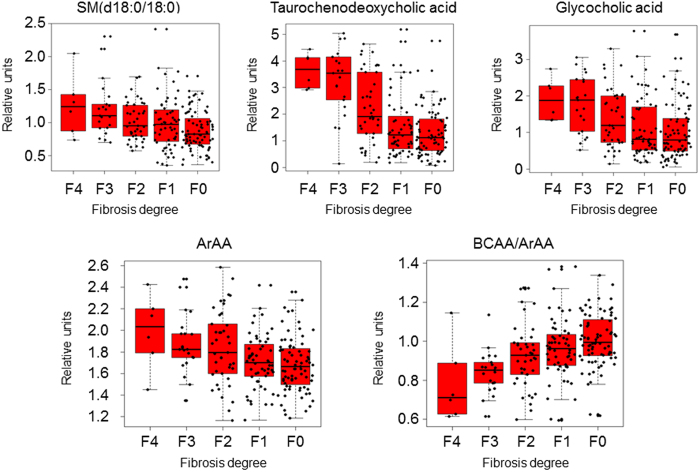
Figure 5.
Boxplots of the relative concentrations for the significantly altered metabolites and ratios in serum of patients considering t test, Pearson correlation coefficient and multivariate analyses. Data is shown in the Supplementary Table S1. X axes represent the fibrosis degree (METAVIR Score), Y axes represent relative units of the semiquantified metabolites or ratios. The bar plots show the normalized values. The boxes range from the 25% and the 75% percentiles; the 5% and 95% percentiles are indicated as error bars; single data points are indicated by dots. Medians are indicated by horizontal lines within each box.

