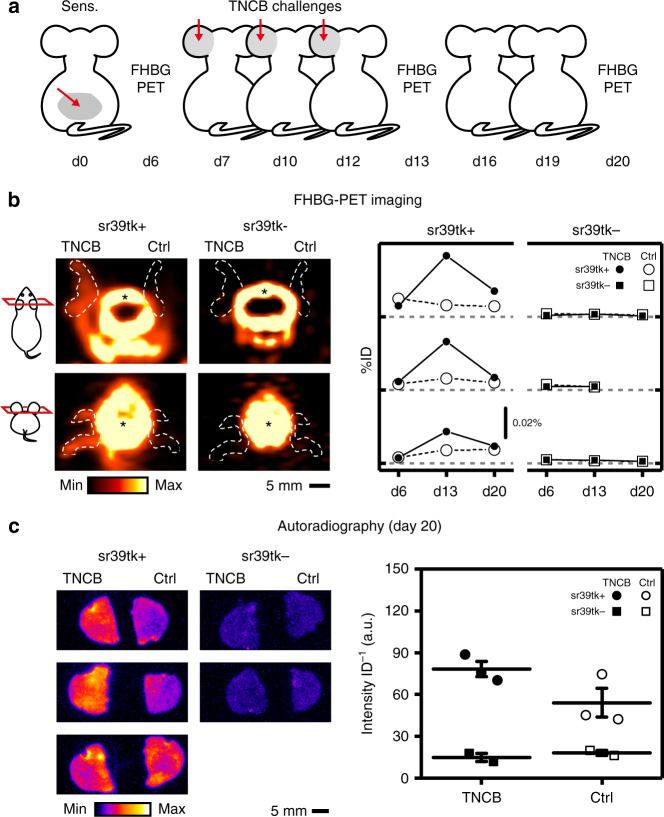
Fig. 4.
Longitudinal tracking of T-cell homing in CD4/sr39tk mice during cutaneous DTHR. a At day 0 (d0), four CD4/sr39tk mice (sr39tk+; genotype: CD4-Cre[tg/+],R26[sr39tk/+]) and three litter-matched Cre-negative control animals (sr39tk−; genotype: CD4-Cre[+/+],R26[sr39tk/+]) were sensitized by cutaneous application of 5% TNCB to the abdomen (red arrow at day d0). Cutaneous DTHR on the left ear was elicited by three repetitive challenges with 1% TNCB on day 7, 10, 12 (red arrows). Animals were analyzed by [18F]FHBG-PET on day 6, 13 and 20, and killed on day 20 for ex vivo analysis of [18F]FHBG uptake. One sr39tk+ animal developed an infection of the TNCB-challenged ear and was excluded from analysis. One sr39tk− animal died on day 20. b Left, representative [18F]FHBG-PET images of the head region of a sr39tk+ and a sr39tk− mouse recorded on day 13. Ear boundaries are outlined by dashed lines; left ears had been challenged with TNCB, whereas right ears had not been challenged (Ctrl). Images were normalized to injected tracer dose. Pictograms on the left show orientation and relative position of the image plane (red). Nonspecific tracer accumulation was detected in bone (*). Right, longitudinal PET imaging showing the time course of [18F]FHBG uptake into TNCB-challenged ears (TNCB, black symbols) and non-challenged ears (Ctrl, white symbols) of individual sr39tk+ (left) and sr39tk− (right) mice. Values were normalized to injected tracer dose (ID); grey dashed lines represent 0% ID for each animal. c Left, [18F]FHBG autoradiography of the ears from three sr39tk+ and two sr39tk− mice at the end of the study on day 20; left ears had been challenged with TNCB; right ears had not been challenged (Ctrl). Right, quantification of [18F]FHBG uptake by autoradiography of the TNCB-challenged ears (TNCB, black symbols) and non-challenged ears (Ctrl, white symbols). Intensity (arbitrary units, a.u.) was background-corrected and normalized to injected tracer dose (ID); data points indicate individual animals; bars represent mean ± s.e.m. See also Supplementary Fig. 5

