
Figure 6.
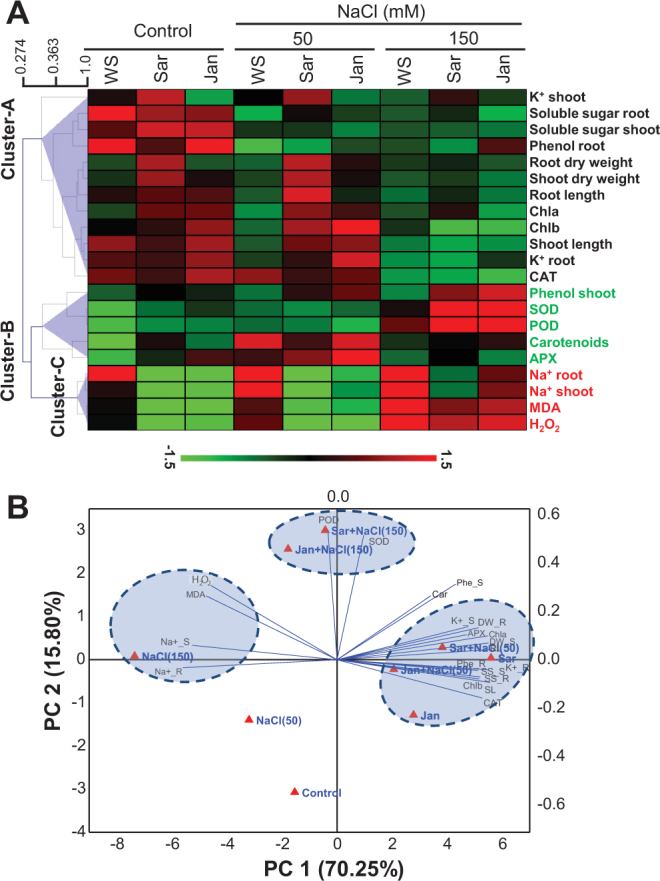
Hierchial clustering and principal component analysis (PCA) to understand treatment-variable relationships in chickpea plants. (A) The mean values of different parameters were normalized and clustered. Variables associated with three major clusters A, B and C are demarcated with black, green and red color, respectively. (B) The entire data were analyzed using PCA. The lines originating from central point of biplots indicate positive or negative correlations of different variables; where their closeness indicates correlation strength with particular treatment. The variables included DW_R (root dry weight), DW_S (shoot dry weight), RL (root length), SL (shoot length), Chl a (chlorophyll a), Chl b (chlorophyll b), Car (carotenoids), SS_R (root-soluble sugars), SS_S (shoot-soluble sugars), Phe_R (root-phenols), Phe_S (shoot-phenols), Na+_R (root-Na+), Na+_S (shoot-Na+), K+_R (root-K+), K+_S (shoot-K+), SOD (superoxide dismutase), CAT (catalase), POD (peroxidase), APX (ascorbate peroxidase), MDA (malondialdehyde) and H2O2 (hydrogen peroxide). Refer to Supplementary Table 1 for cumulative PCA scores for each treatment. WS, Sar and Jan represent plants receiving foliar application of water, Sar and Jan extracts, respectively.