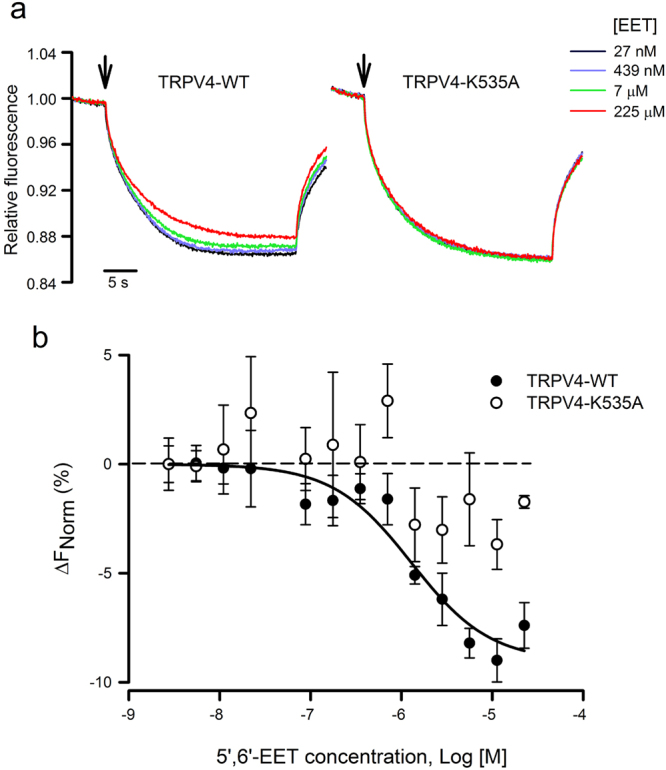
Figure 2.

Thermophoretic analysis of the TRPV4-EET interaction. (a) Typical signal of a microscale thermophoresis (MST) experiment showing the thermophoretic movement (induced by infrared laser activation, arrow) of the GFP-labeled TRPV4 WT or K535A mutant channel and the subsequent fluorescence change measured for 30 s in the presence of increasing concentrations of 5′,6′-EET, from 27 nM (blue trace) to 225 µM (red trace). GFP-TRPV4 channels and 5′,6′-EET were incubated for 30–60 min in PBS, with 2% ethanol as vehicle. (b) Average changes in normalized fluorescence obtained for GFP-labeled TRPV4 WT (n = 4) and K535 (n = 4) channels plotted against 5′,6′-EET concentration and fitting of the TRPV4-WT data.
