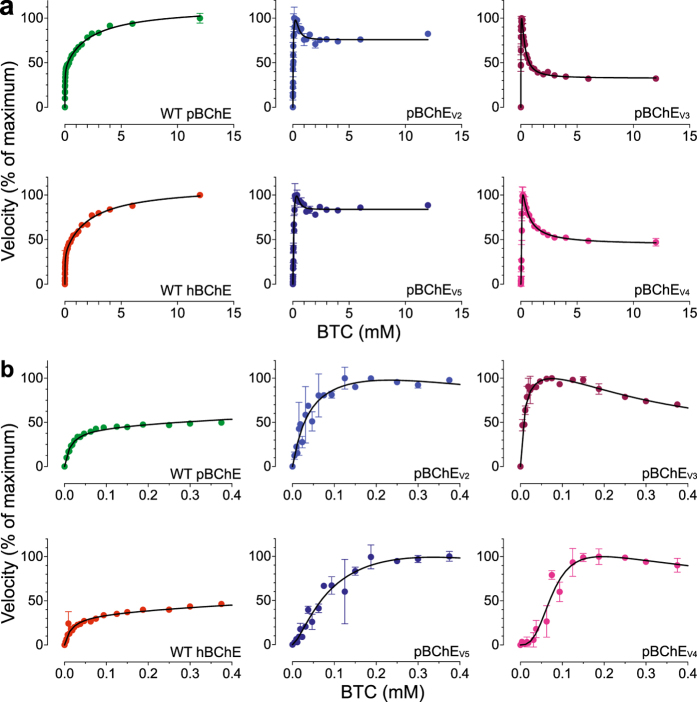
Figure 2.
BTC hydrolysis by WT hBChE, WT pBChE, and pBChEV2-5. (a) Reaction rates are plotted against substrate concentration (mean ± SEM). Plots in (b) zoom in on the low range of substrate concentrations. The 100% values and the goodness of fit values are as follows: WT hBChE, 100% = 1.57 ± 0.04 nmol/min, Equation (2), R2 = 0.98; WT pBChE, 100% = 1.21 ± 0.07 nmol/min, Equation (2), R2 = 0.99; pBChEV2, 100% = 0.79 ± 0.10 nmol/min, Equation (3), R2 = 0.83; pBChEV3, 100% = 0.96 ± 0.01 nmol/min, Equation (3), R2 = 0.95; pBChEV4, 100% = 8.9 ± 0.6 nmol/min, Equation (3), R2 = 0.95; pBChEV5, 100% = 8.1 ± 0.3 nmol/min, Equation (3), R2 = 0.95.

