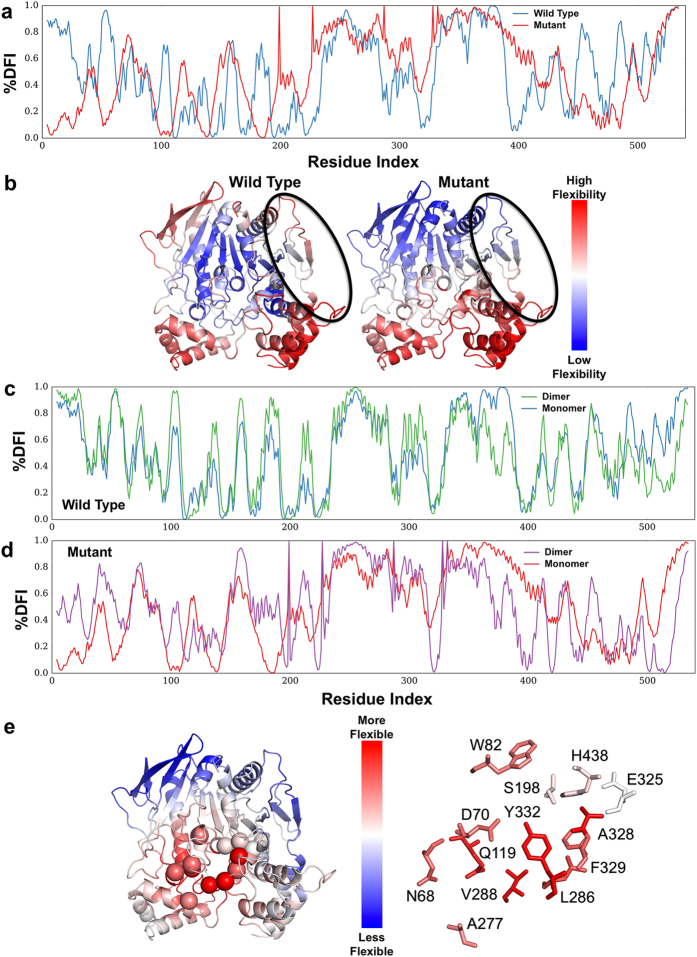
Figure 6.
% DFI profile of WT hBChE and pentavalent mutant. (a) The % DFI profiles of WT BChE (blue) and BChEV4 (x-axis – residue numbers, y-axis – % DFI values at each position). (b) Color-coded structure diagrams depicting the % DFI values at each position. The circled regions are part of the monomer-monomer contact region (V377, D378, T457, K458, A459, I462, Y500, R509, M511, T512, K513, R514, L515). (c) The % DFI profiles of monomeric (blue) and dimeric (green) WT BChE. (d) The % DFI profiles of monomeric (red) and dimeric (purple) BChEV4. (e) Color-coded structure diagrams depicting the values of % DFI differences between the dimeric forms of WT BChE and BChEV4 at each position. The red-white-blue code reveals loci with increased flexibility (shades of red), decreased flexibility (shades of blue) or no change (white) in the mutant dimer vs. the WT dimer.

