Figure 2.
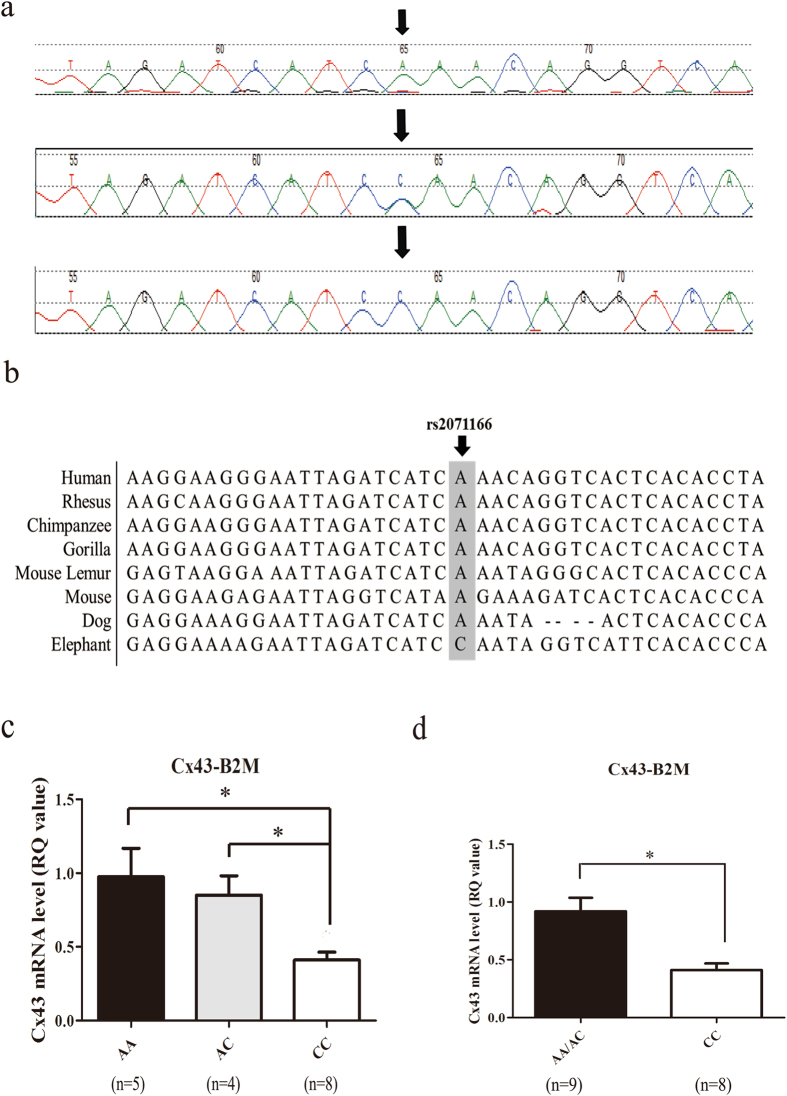
Sequence diagram of the rs2071166 site and the Cx43 mRNA level in patients with different genotypes. (a) Arrows indicate the SNP site. Genotype: top, AA; middle, AC; bottom, CC. Green, black, red and blue represent the A allele, G allele, T allele and C allele, respectively. (b) The Cx43 promoter region is similar among mammals, such as chimpanzee, gorilla and mouse lemur, etc. The position of the SNP site was marked by black arrows. (c,d) The relative mRNA expression level of Cx43 was analyzed in samples from 9 patients with the AA/AC genotype and 8 patients with the CC genotype, with B2M as an internal control. Bar, SE. *p < 0.05.

