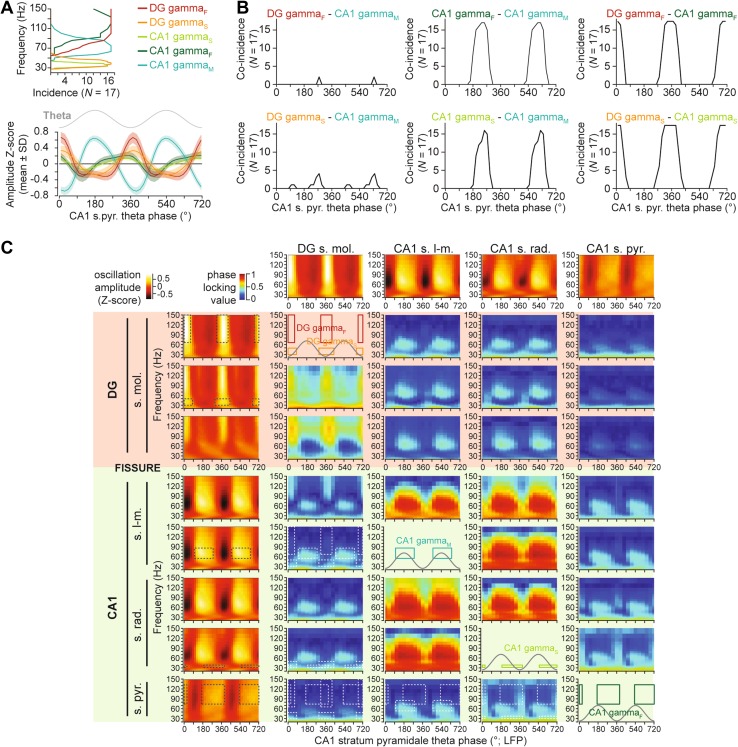
Fig. 2.
Co-occurrence and coherence of gamma oscillations in the dentate gyrus and CA1 area. a Frequency distribution (upper plot) and theta phase-amplitude modulation of different gamma oscillations. Theta phase here, and throughout the manuscript, was measured in the pyramidal cell layer of CA1 area. b Overlap in the occurrence (defined as a positive mean Z score) of different gamma oscillation pairs during the theta cycle. Note that the DG gammaF–CA1 gammaF and DG gammaS–CA1 gammaS oscillation pairs show substantial overlap in their frequency and theta phase distributions. c Phase coherence (measured as phase locking value; PLV) between oscillatory activities in contact pairs, displayed as a function of theta phase, and frequency. In the top row, and the left column, mean CSD oscillation amplitude Z-scores are plotted for selected contacts in stratum moleculare, stratum lacunosum-moleculare, stratum radiatum, and stratum pyramidale, as indicated. At the intercept of these, phase coherence between pairs of contacts (displayed as colour-coded phase locking value) is plotted as a function of theta phase (18° bins, the theta cycle is duplicated for visualization), and gamma frequency (53 logarithmically equidistant wavelet scales between 20 and 150 Hz). In plots at the intercept of a contact with itself, the theta phase and frequency ranges of different gamma oscillations prominent in the particular contact are displayed, for reference (also plotted as black dotted lines on the left column amplitude plots). White dotted lines indicate these same ranges on coherence plots, to indicate overlaps in frequency and theta phase ranges of different gamma oscillations

