
Fig. 2.
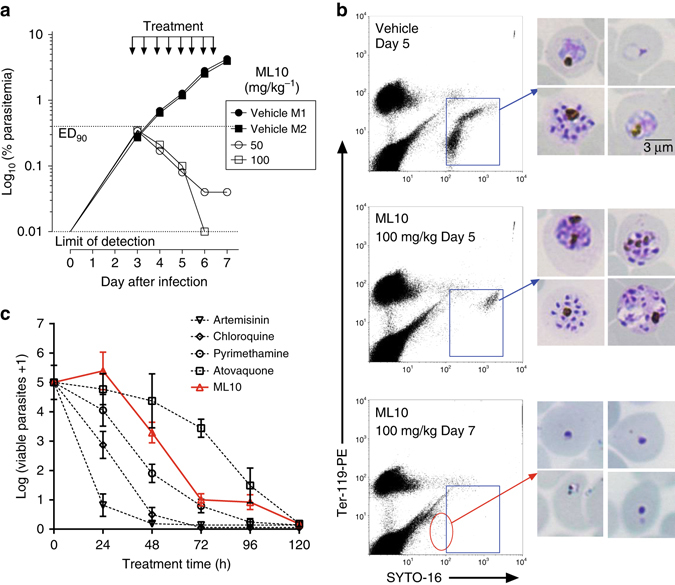
Efficacy of ML10 against P. falciparum in the GSK PfalcHuMouse model and determination of in vitro killing dynamics. a Two mice were treated with vehicle and another two mice with either 50 or 100 mg/kg of ML10 to test proof of concept of efficacy in vivo. Parasitemia is shown over time in individual mice during the efficacy assay. The dotted horizontal line indicates 90% reduction in parasitaemia compared to vehicle-treated animals. Each symbol represents an individual mouse. b Microscopic and flow cytometric analysis of P. falciparum present in the peripheral blood of mice treated with vehicle or ML10. Samples taken after one (48 h) and two cycles (96 h) of exposure to the test compound were further analyzed. Flow cytometry dot plots from samples of peripheral blood show P. falciparum-infected human erythrocytes (blue rectangle). Images in the right-hand panels show Giemsa-stained blood stage parasites. Blood films from control untreated animals show normal staining and appearance. The parasites in ML10-treated animals show a relative enrichment in late schizonts at Day 5, whereas most cells remaining in peripheral blood at Day 7 are pyknotic (red circle). Scale bar, 3 µm. c The in vitro parasite reduction rate (PRR) assay was used to determine the onset of action and rate of killing as previously described24. P. falciparum was exposed to ML10 at a concentration corresponding to 10× EC50. The number of viable parasites at each time point was determined as described24. Four independent serial dilutions were tested with each sample to correct for experimental variation; error bars show the standard deviation. Previous results reported on standard antimalarials tested at 10× EC50 using the same conditions are shown for comparison24