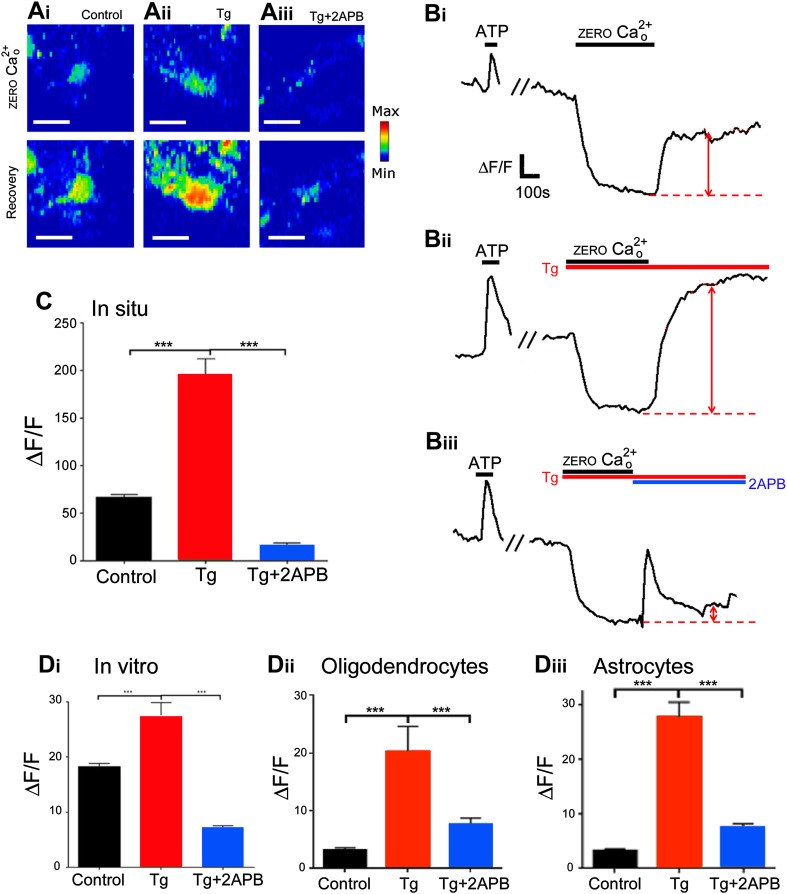
Fig. 5.
SOCE in optic nerve glia. Mouse optic nerves were isolated intact and loaded with Fluo-4 to analyse SOCE, using thapsigargin (10 µM for optic nerves, 2 μM for explant cultures) to block ER reuptake and 2APB (50 µM) to block SOCE channels. Confocal images of Fluo-4 fluorescence intensity illustrated in rainbow false colour (a, scale bars 10 μm) and representative traces of individual glia (b), illustrating that removal of extracellular [Ca2+]o results in a decline in cytosolic [Ca2+]i, which recovers rapidly on return to normal aCSF (ai, bi, red arrow), and this is markedly increased in the presence of thapsigargin (aii, bii, red arrow) and decreased in the presence of 2APB (aiii, biii, red arrow). Bar graphs showing the mean rise in cytosolic [Ca2+]i (indicated by red arrows in bi–iii) in aCSF control, thapsigargin and 2APB, in situ in the isolated intact optic nerve (c) and in vitro in explant cultures (d), illustrating results from all glia (di) and separately for oligodendrocytes (dii) and astrocytes (diii), identified by differential expression of PLP-DsRed; data are mean ± SEM change in fluorescence (ΔF/F), ***p < 0.01, unpaired t test with Welch’s correction

