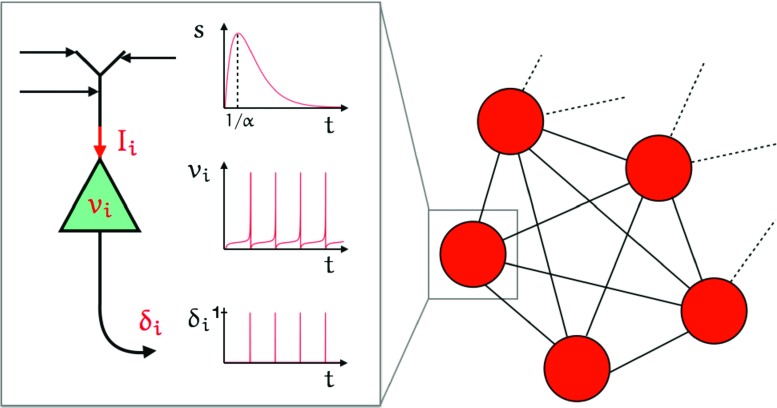
Fig. 4.
Neural network: The diagram on the right shows an all-to-all coupled network. The zoom on the left shows each of the components of Eqs. (1), (3) and (4). The top plot of the zoom shows the shape of the synaptic filter for the case that s(t) is an α-function: s(t) = α 2 t e−αtΘ, where 1/α is the time-to-peak. I i is the total synaptic current that enters the cell body and v i is the voltage of the cell which oscillates as shown in the middle plot. The corresponding output spike train is given by a sequence of Dirac-delta functions , as illustrated in the bottom plot

