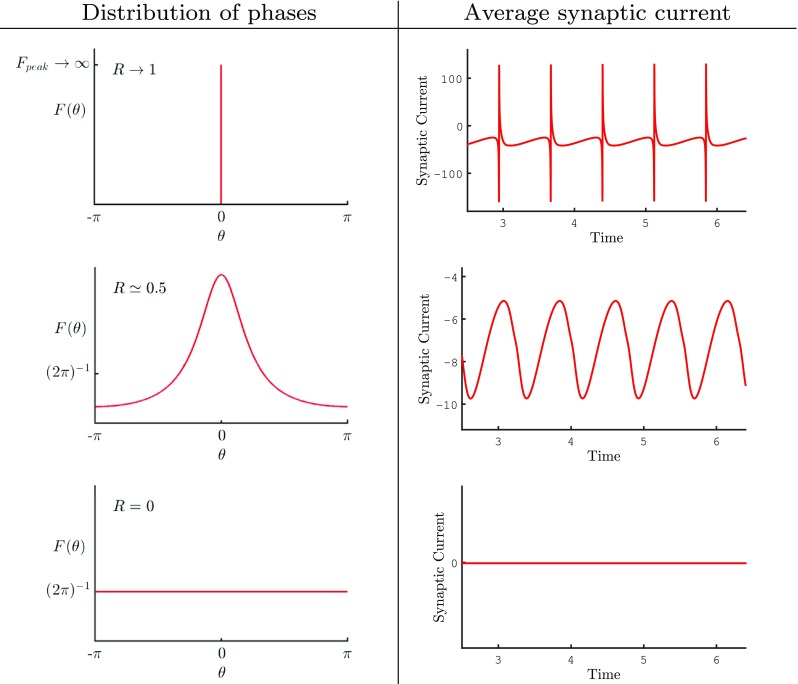
Fig. 7.

Distribution of phases: Figure illustrating the distribution of phases F(θ) in the large N limit and the average synaptic current for different values of the population coherence R. For simplicity we have fixed the choice of time so that Ψ(t) = 0. When the population is completely synchronous (R = 1) all of the neurons have the same phase and as a result all of the neurons fire together so that F(θ) = δ(θ) and the average synaptic current is very spiky. In the regime where R ≃ 0.5 the phases are more distributed. Although a dominant phase can be clearly identified (by the peak value) not all neurons have this phase. The OA ansatz gives the shape of the distribution in the form F(θ) = (2π)−1(1 −|Z|2)/(|eiθ − Z|2). This spread in the phase distribution acts to smooth out the spikes in the average synaptic current to create a smooth oscillatory signal. When the population of neurons is completely asynchronous there is no dominant phase and every phase is equally probable so that F(θ) = 1/(2π). In this case all of the neurons fire at different times with their phases uniformly distributed to yield a constant synaptic current. Note that the peak in the distribution of phases move as the system evolves with time with a velocity
