Figure 1.
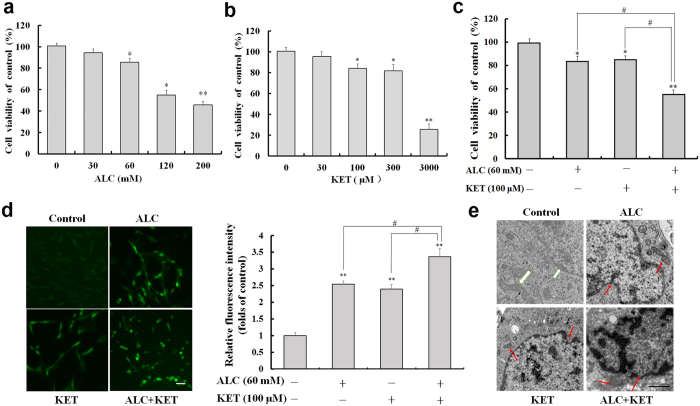
Cell viability, ROS level and morphological changes induced by ALC and/or KET in PC12 cells. (a) ALC (60–200 mM) dose-dependently decreased the cell viability of PC12 cells. (b) KET (100–3000 μM) dose-dependently decreased the cell viability of PC12 cells. (c) ALC (60 mM) potentiated KET (100 μM)-induced cell viability decrease in PC12 cells. (d) ALC (60 mM) potentiated KET (100 μM)-induced ROS level increase in PC12 cells by DCFH-DA staining. Scale bar = 20 μm. (e) ALC (60 mM) potentiated KET (100 μM)-induced morphological changes in PC12 cells by transmission electron microscope. Scale bar = 1 μm. The white arrows represent cells with normal nuclei and mitochondria. The red arrows represent abnormal nuclei and mitochondria. *p < 0.05, **p < 0.01 compared with the control group. # p < 0.05 compared with the group treated with ALC and KET.

