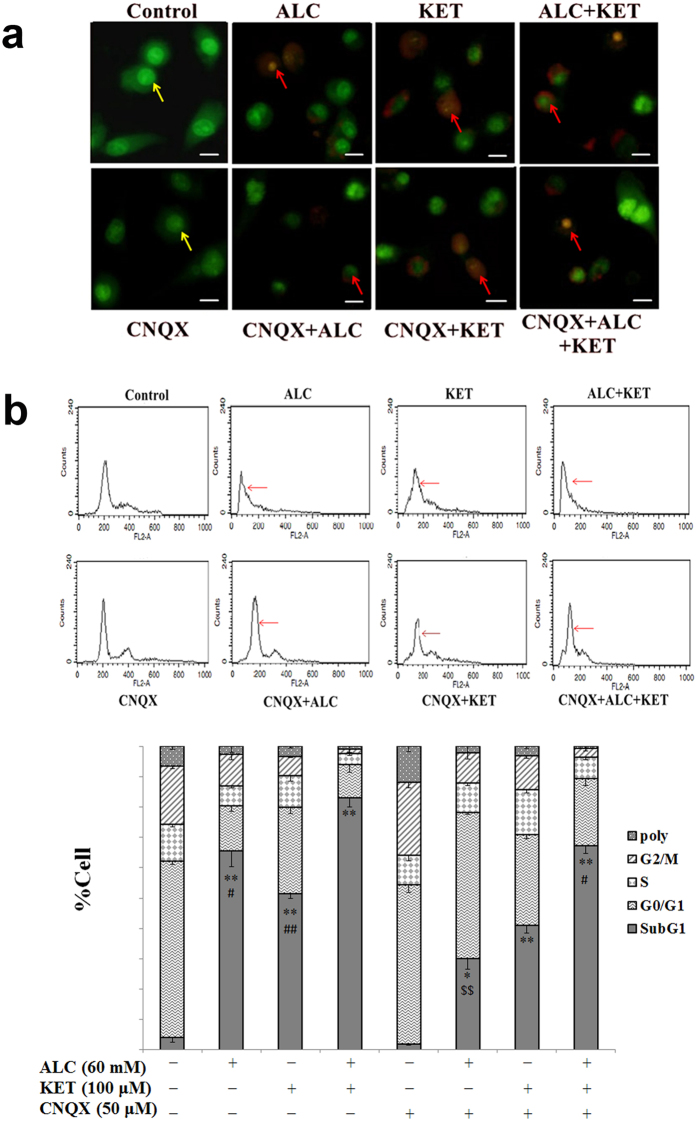
Figure 4.
ALC potentiates KET-induced apoptosis. (a) ALC (60 mM) potentiated KET (100 μM)-induced apoptotic changes investigated by AO-EB staining. The yellow arrows represent normal nuclei in the control group. The red arrows represent apoptotic changes after ALC and/or KET treatment. Scale bar = 20 μm. (b) ALC (60 mM) potentiated KET (100 μM)-induced sub-G1 phase increase investigated by flow cytometry analysis. *p < 0.05, **p < 0.01 compared with the control group. # p < 0.05, ## p < 0.01 compared with the group treated with ALC and KET. $$ p < 0.01 compared with the group treated with ALC.

