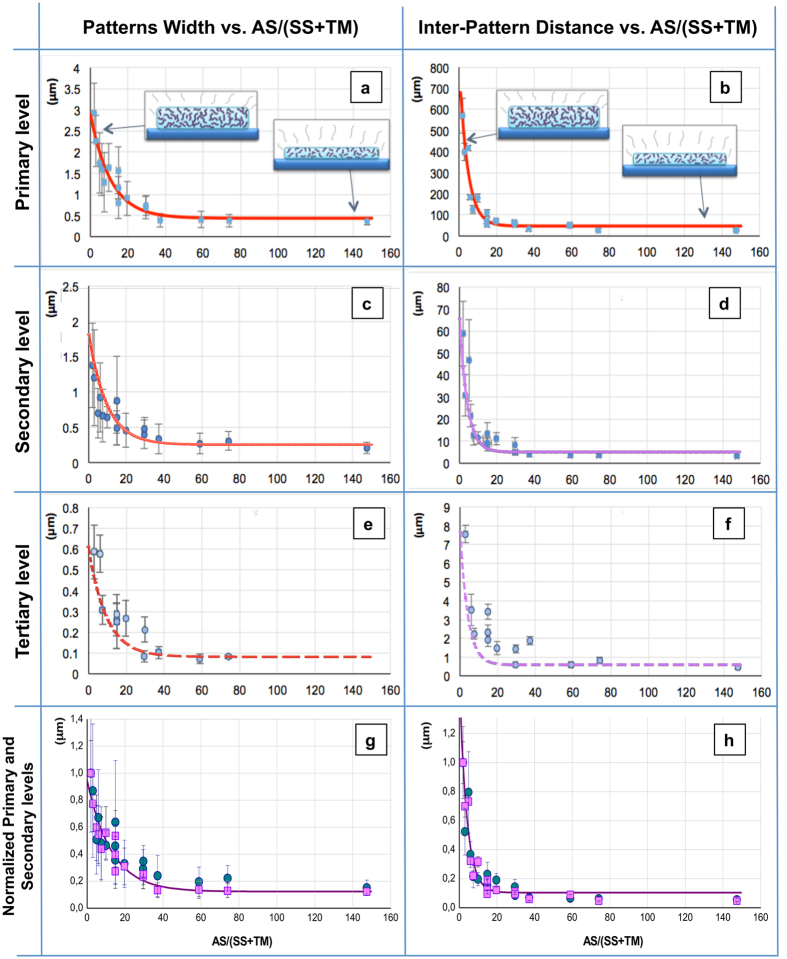
Figure 5.
(a–f) Plots of the Pattern Widths (left column) and Inter-Pattern Distances (right column) arranged along three rows (Primary level (a,b), row 1; Secondary level (c,d), row 2; Tertiary level (e,f), row 3) in function of the AS/(TM + SS) ratios for the patterns obtained from the 16 different realized TSs. Each data point is the result of 20 + different measurements, and the error bars show the data standard deviation. The red interpolating curves in the two plots of row 1 are the best fits for the given data points of the Primary levels; the purple continuous interpolating curves at the Secondary levels are exactly the same fits of the Primary levels, just graphically overlapped onto the collected data points (hence they are not actual fits). The purple dashed interpolating curves at the Tertiary level are again the same graphical respective fits of row 1, and are overlapped to actual data as a guide to the eye. In the insets of the Primary levels panels (row 1): qualitative sketches of the solid SS/TM layer thickness obtained at different AS/(TM + SS). (g,h) Normalized Primary (pink squares) and Secondary (blue circles) levels Pattern Widths (g) and Inter-Pattern Distances (h). The fitting curves (purple plots) are calculated for the Primary levels of the patterns (see text for details).

