Figure 3.
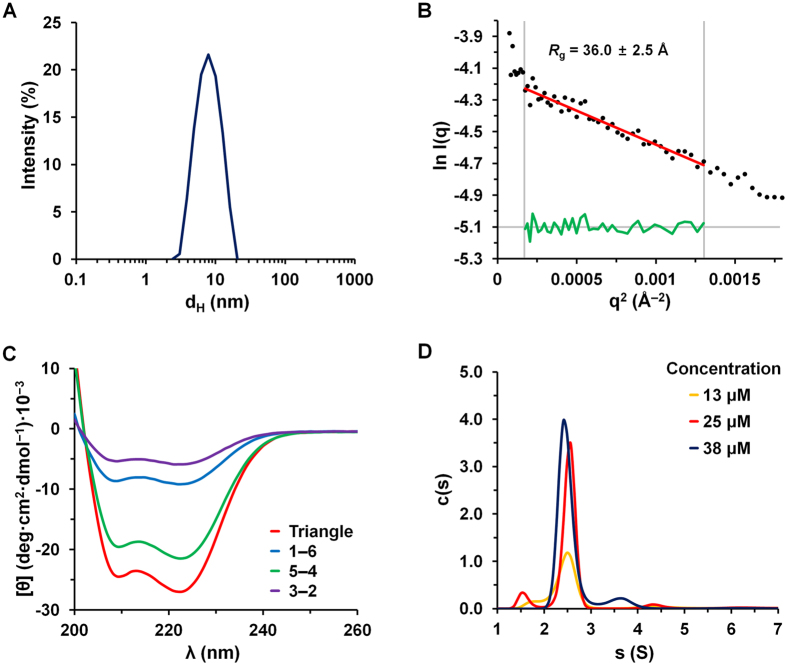
Characterization of size, folding, and assembly of the protein nanotriangle. (A) The hydrodynamic diameter (d H) of the protein nanotriangle as determined by DLS. (B) Guinier plot to determine R g from SAXS measurements at 44 μM (black dots; Fig. S8). The fit (red line with residuals in green) is for data in the low-q range (q × R g < 1.3). (C) CD spectra for 1–6, 5–4, and 3–2 and the purified assembly (triangle) (5 μM of each protein and 15 μM total for mixtures, 20 °C). (D) Distributions of sedimentation coefficient (s), in Svedbergs (S), for the protein nanotriangle at concentrations of 13, 25, and 38 μM, estimated from interference boundary fits (Fig. S11).

