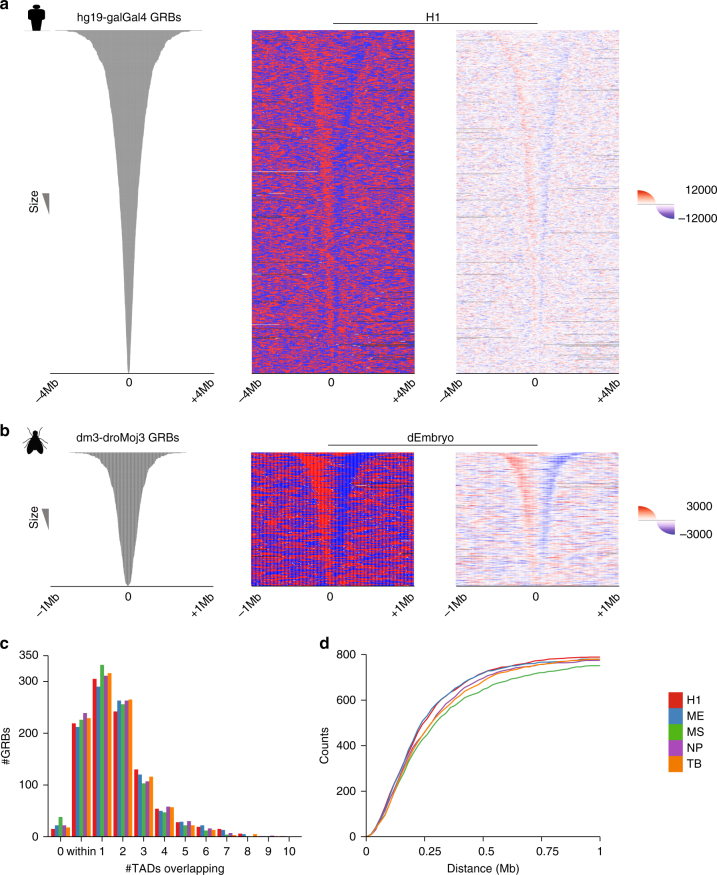
Fig. 2.
The boundaries of GRBs predict the boundaries of TADs in multiple evolutionarily distant species. a Heatmaps representing H1-ESC directionality index spanning an 8 Mb window around the centre of putative hg19-galGal4 GRBs. Showing both the overall direction (middle panel, red for downstream, blue for upstream) and the average raw directionality score in 5 kb bins (right panel). b Heatmaps of Drosophila embryo Hi-C directionality index spanning a 2 Mb window around the centre of dm3-droMoj3 GRBs. Showing both the overall direction (middle panel, red for downstream, blue for upstream) and the average raw directionality score in 1 kb bins (right panel). c A large number of GRBs were found to be located within individual TADs (identified using HOMER) or overlapping only a single TAD, regardless of cell lineage (H1-ESC (H1), mesenchymal stem cells (MS), mesendoderm (ME), neural progenitor cells (NP) and trophoblast-like (TB)). d Cumulative distribution of distance to nearest TAD (HOMER) boundaries from GRB boundaries in different cell lineages considering both edges, i.e., both the start and end positions of a GRB lie within X kb of the nearest TAD start and end

