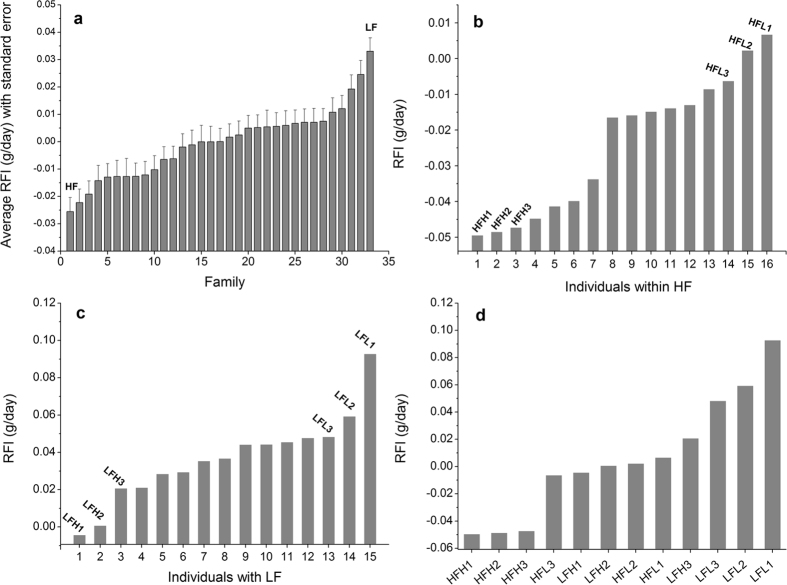
Figure 1.
RFI distribution of test families and candidate individuals. (a) RFI distribution of 33 test families. (b) RFI distribution of individuals within the family with the highest feed efficiency (HF). The three most efficient individuals (HFH1, HFH2 and HFH3) and the three least efficient individuals (HFL1, HFL2 and HFL3) are indicated. (c) RFI distribution of individuals within the family with the lowest feed efficiency (LF). The three most efficient individuals (LFH1, LFH2 and LFH3) and the three least efficient individuals (LFL1, LFL2 and LFL3) are also indicated. (d) RFI distribution of the 12 individuals used for RNA-seq.

