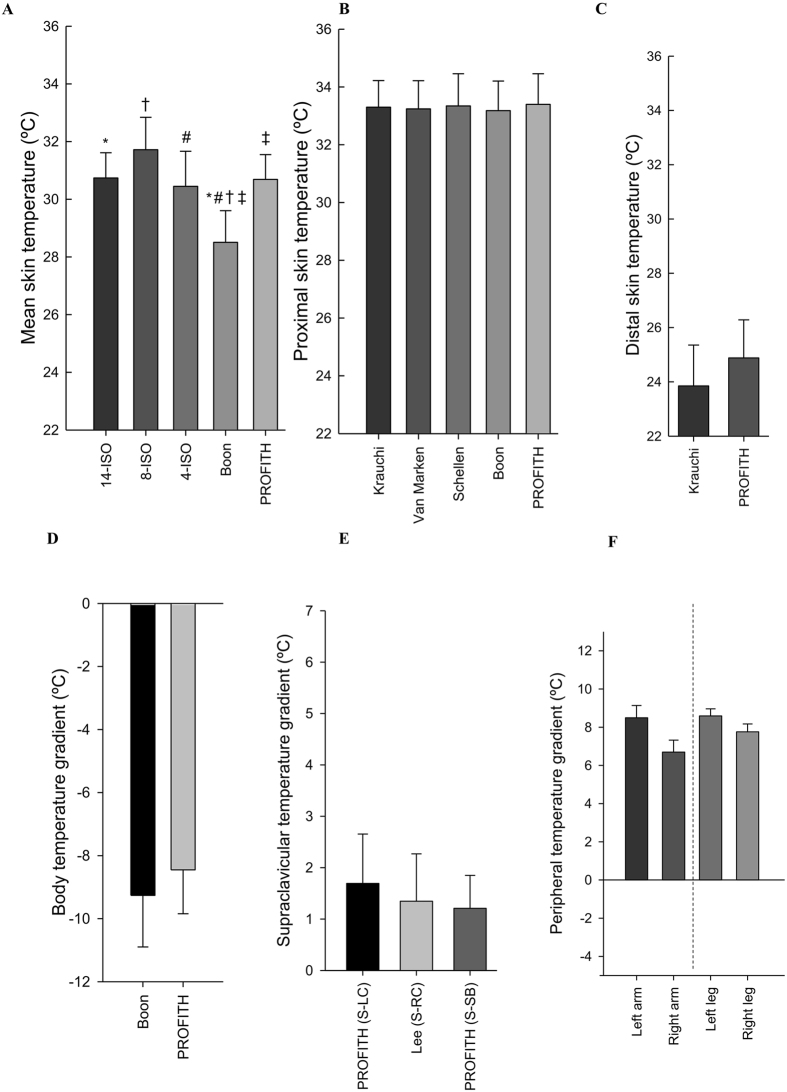
Figure 5.
Measures of skin temperature at the last five minutes of the second warm period as estimated with the equations used in the respective references. (A) Mean skin temperature: *P ≤ 0.001: 14-ISO vs. Boon; †P ≤ 0.001: 8-ISO vs. Boon; #P = 0.002: 4-ISO vs. Boon; ‡P = 0.001: Boon vs. PROFITH. (B) Proximal skin temperature: All P = 1.000. (C) Distal skin temperature: P = 0.113. (D) Body temperature gradients: P = 0.252. (E) Supraclavicular temperature gradients: All P ≥ 0.575. (F) Peripheral temperature gradient: All P = 1.000. Data are mean and standard error.

