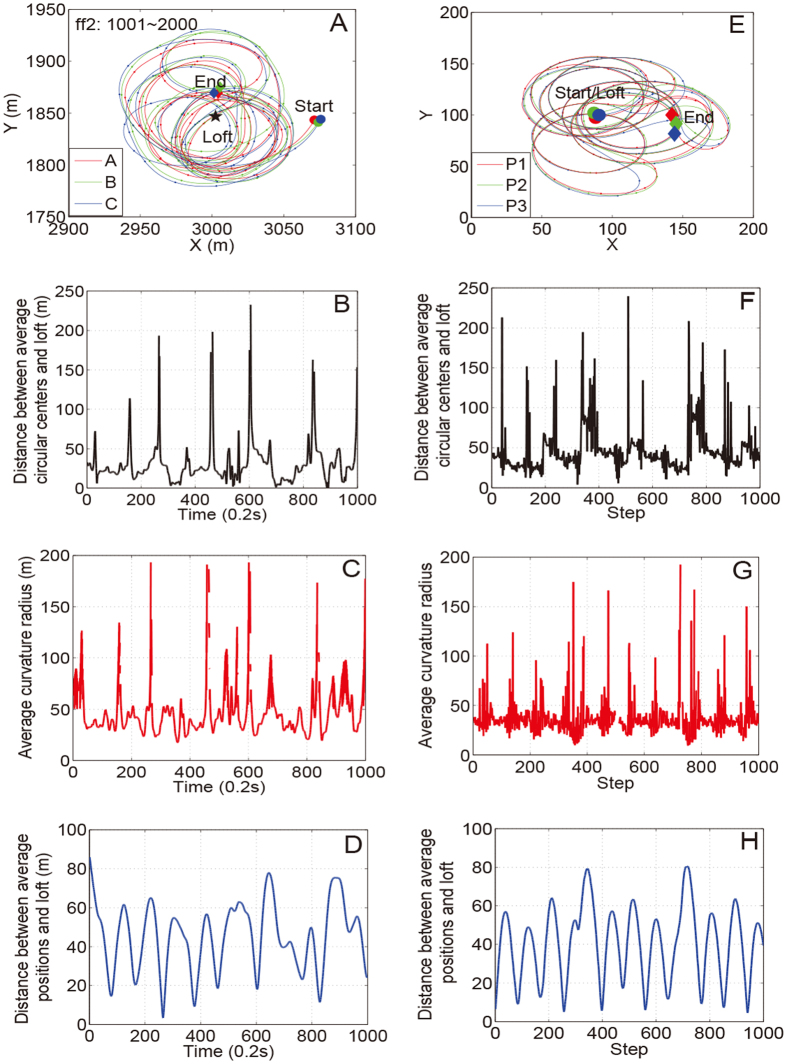
Figure 5.
Comparison between experimental results and numerical simulations. (A) 200 s long (1000 time steps) segment of flight trajectories from flock D release ff2. For better visibility, only three pigeons are exhibited. (B–D) The distances between the average circular centers and loft, average curvature radius, and distances between the average positions and loft, respectively. If the pigeon flock flies relatively straight for three continuous instants, the average curvature radius will grow larger in synchronized manner with peaks in (B) and (C). (E–H) Results corresponding to the 1000 steps of the numerical simulations.

