Figure 6.

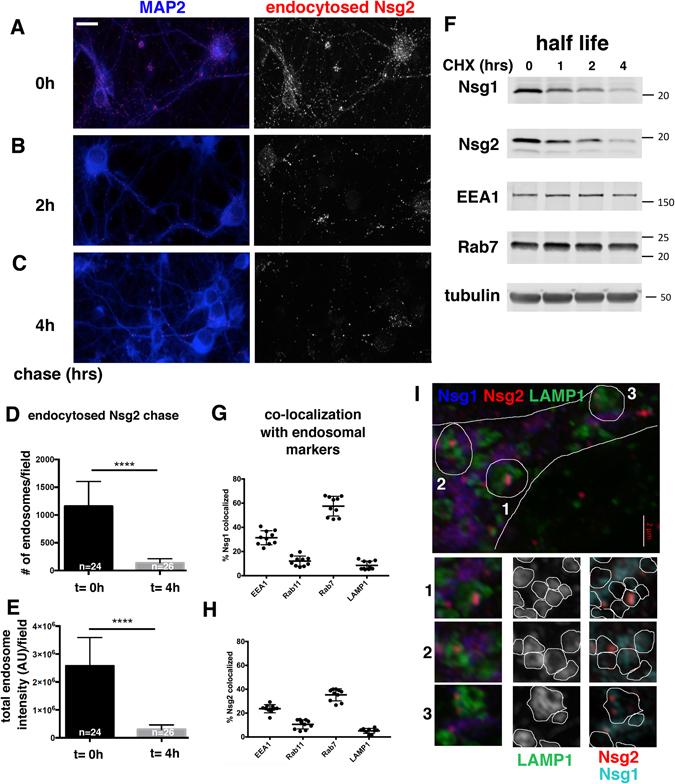
Nsg1 and Nsg2 degrade rapidly. (A–C) Neurons were fed live with anti-Nsg2 antibodies (red) to load endosomes and then washed, fixed immediately t = 0 (A), or chased for 2 hours (B) or 4 hours (C). MAP2 was used as a counterstain to identify dendrites (blue). The red channel alone is shown in the right panels. Very little endocytosed Nsg2 remains in cells after 4 hours of chase. (D,E) Quantification of number of Nsg2-containing endosomes (D) and fluorescence intensity in Nsg2-containing endosomes (E) at t = 0 and t = 4 hours of chase. N = number of microscopy fields quantitated in two independent experiments. The total number of cells quantified for these graphs was >600. The differences are highly significant (Mann-Whitney test; p < 0.0001). (F) Half-lives of Nsg1 and Nsg2 were determined by Western blotting of neuronal membrane fractions after treatment with cycloheximide (CHX) for 0, 1, 2 and 4 hours. EEA1 and Rab7 were also blotted for comparison. Both displayed much longer half-lives than Nsg1 and Nsg2. The neuronal isoform β3-tubulin is shown as a loading control to normalize across the different lysates. One representative experiment of three independent repeats is shown. Cropped blots are displayed. The full length blots are shown in Suppl. Figure S8. (G,H) Extent of co-localization of Nsg1 (G) and Nsg2 (H) with EEA1, Rab11, Rab7 and LAMP1 was quantified for ten fields of 3D reconstructed confocal stacks using Imaris software. Each data point corresponds to one microscope field containing multiple cells and up to five dendrites per field. (I) Co-localization of Nsg1 (blue) and Nsg2 (red) with the lysosomal marker LAMP1 (green) was visualized with 3D superresolution Airyscan microscopy. Co-localization was not striking at steady-state, but clear instances could be observed. In many examples, the interior lumen of the doughnut-shaped lysosomes could be resolved and frequently Nsg1 and Nsg2 were found inside. Three examples are circled in the panel and each is shown below as smaller insets with separate channels. Individual putative lysosomes are identifiable and were circled in the LAMP1 channel (center panels). This mask was then duplicated onto the Nsg1/Nsg2 channels (red and aqua) in the right hand panels.
