Figure 5.

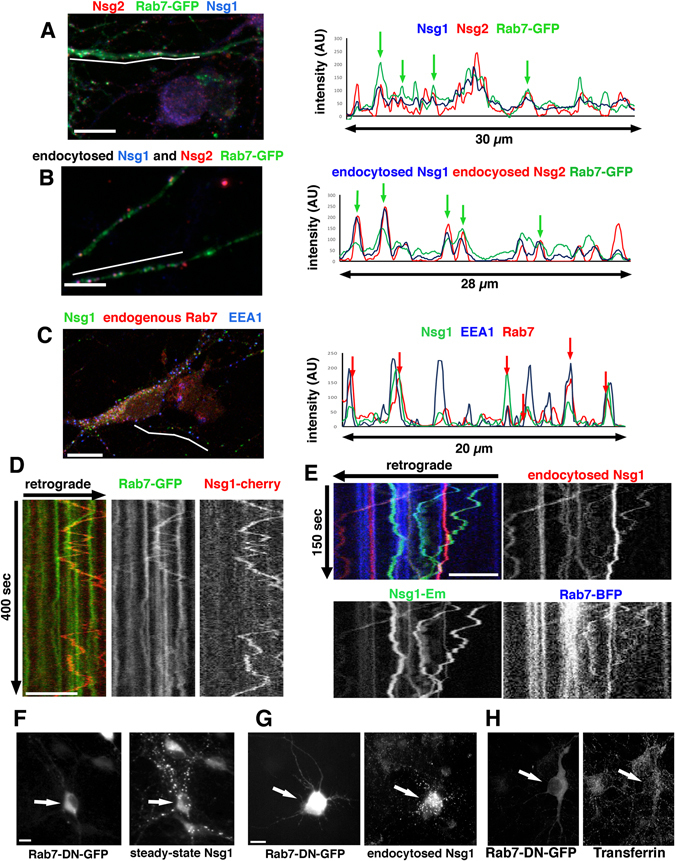
Nsg1 and Nsg2 travel in Rab7-positive late endosomes. (A–C) Co-localization of Nsg1 and Nsg2 with Rab7. MAP2 was counterstained to identify dendrites for line scans in all experiments, but the channel is not shown. The white line indicates the location of the corresponding line scans. (A) GFP-Rab7 (green) was transfected into DIV8 neurons and cells were counterstained against endogenous steady-state Nsg1(blue) and Nsg2 (red). Bar = 10 µm. A line scan is shown on the right. Green arrows indicate GFP-Rab7 endosomes also containing Nsg1/2. (B) GFP-Rab7 (green) was transfected into DIV8 neurons and simultaneous endocytosis assays were performed using anti-Nsg1 (blue) and Nsg2 (red) antibodies. Endocytosed Nsg1 and Nsg2 were detectable in Rab7-positive endosomes. Bar = 10 µm. A line scan is shown on the right. Green arrows indicate Rab7-GFP endosomes also containing endocytosed Nsg1 and Nsg2. (C) Confocal images of endogenous Rab7 (red), Nsg1(green) and EEA1 (blue) staining reveals partial co-localization. Bar = 10 µm. A line scan is shown on the right. Red arrows indicate Rab-7 endosomes containing Nsg1. (D,E) Live imaging of Nsg1 with Rab7 reveals co-motility. (D) Dual live imaging was carried out in neurons expressing GFP-Rab7 and Nsg1-mcherry. The kymograph illustrates Nsg1-mcherry in a subset of GFP-Rab7 endosomes which were often motile. A merged panel of both channels as well as each channel separately are shown. Bar = 10 µm. The position of the retrograde direction is indicated by the arrow. (E) Triple live imaging was carried out in neurons transfected with Nsg1-Em (total Nsg1; green) and BFP-Rab7 (blue). Endocytosis assays of Alexa568-anti-Em antibody was carried out to visualize endocytosed Nsg1 (red). The kymograph illustrates that endocytosed Nsg1 (red) co-localized with a subset of BFP-Rab7 (blue) and often moved retrogradely in Rab7-positive endosomes. Anterograde co-motility is also observed. A merged panel of all channels as well as each channel separately are shown. Bar = 10 µm. (F–H) Rab7-DN expression leads to accumulation of steady-state (F) and endocytosed Nsg1 (G). Nsg1 staining in the transfected neuron is brighter than in non-transfected neurons in the same field. Corresponding experiments for Rab7 knock down and Rab7-DN are shown in Suppl. Figure S7 for both endogenous Nsg1 and Nsg2. (H) Tfn levels were not increased in cells expressing Rab7-DN compared to non-transfected neurons. Arrows indicate transfected cell. Bar = 10 µm.
