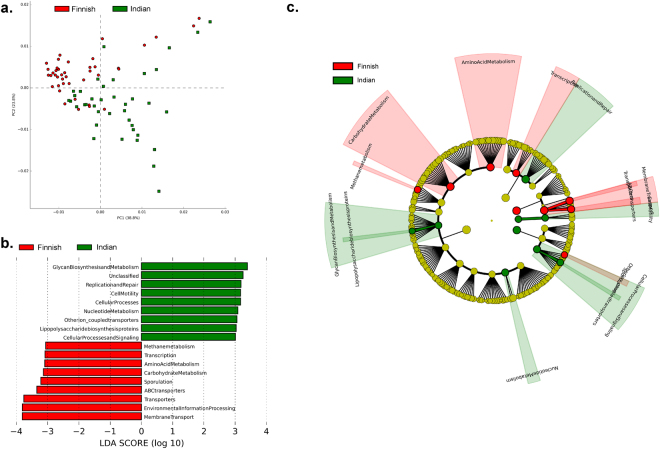
Figure 6.
Imputed metagenomic functions of the gut bacterial community. (a) PCA plot is illustrating differences in metabolic functions of the gut bacterial community of Finnish (red) and Indian (green) children. (b) Bar chart is representing specific metabolic function differential abundant in Finnish and Indian children (Effect size filter = >2.0). (c) Cladogram representing differences in abundance of microbial genes between the gut bacterial community of Finnish and Indian children contributing in specific metabolic pathways.

