Figure 5.
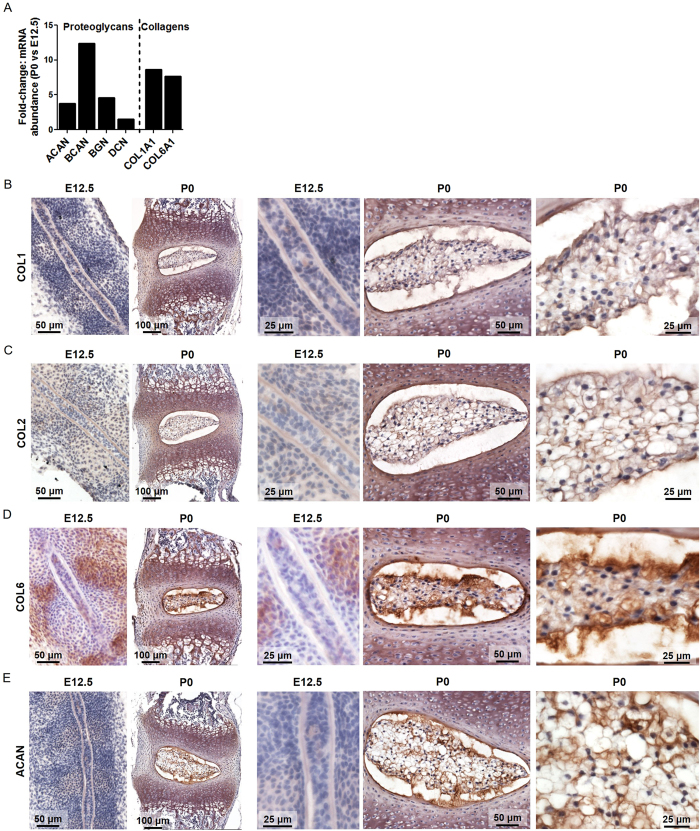
Fold-change in mRNA expression of P0 vs E12.5 NDCs and immunohistochemical analysis of key ECM molecules at E12.5 and P0. (A) Fold-change in mRNA expression of proteoglycans and collagens showing significant upregulation at P0. Protein staining for (B) COL1, (C) COL2, (D) COL6, and (E) ACAN, showing weak staining in non-cellular regions (core and sheath) of the E12.5 notochord and intense positive staining of the NP at P0. N = 4, all fold changes p < 0.05, P0 compared to E12.5, analyzed by DESeq2 and adjusted for false discovery rate. Refer to Fig. 2 for annotation of structural regions.

