
Figure 2.
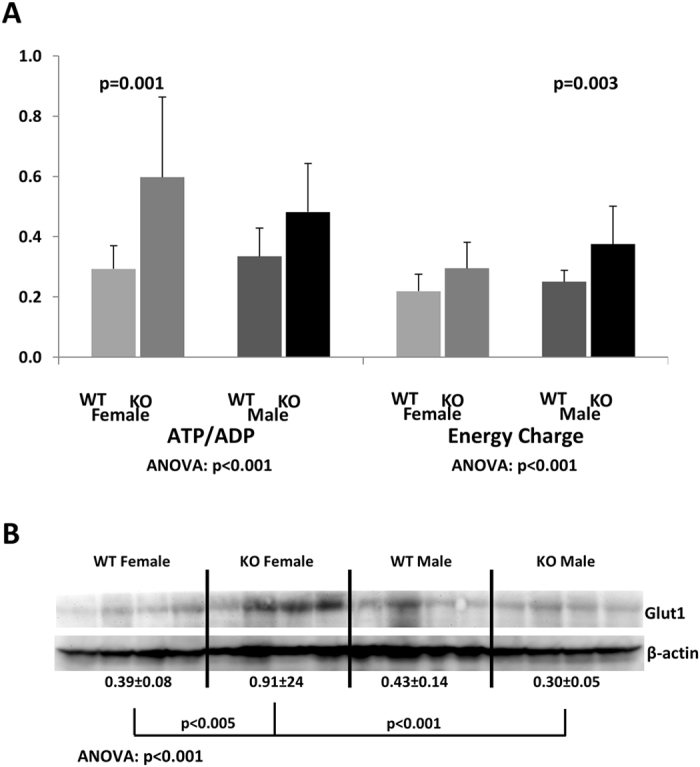
Energy state of the kidney following CypD ablation. (A) Comparison of ATP/ADP-ratios and energy charge between the kidneys of female and male Ppif−/− (KO) and wild-type (WT) mice. Data is presented as average ± SD (n = 9–14) (measured concentrations [µM] were normalized to protein [mg] prior to ratio calculations). (B) Expression of Glut1 glucose transporter. Data was normalized to β-actin and is presented as average ± SD (arbitrary units, n = 4). One-way ANOVA results with Tukey post-hoc significance levels are presented below. Abbreviations: ADP: adenosine diphosphate, ATP: adenosine triphosphate, AMP: adenosine monophosphate, energy charge calculated as [ATP + (0.5 × ADP)]/(ATP + ADP + AMP).