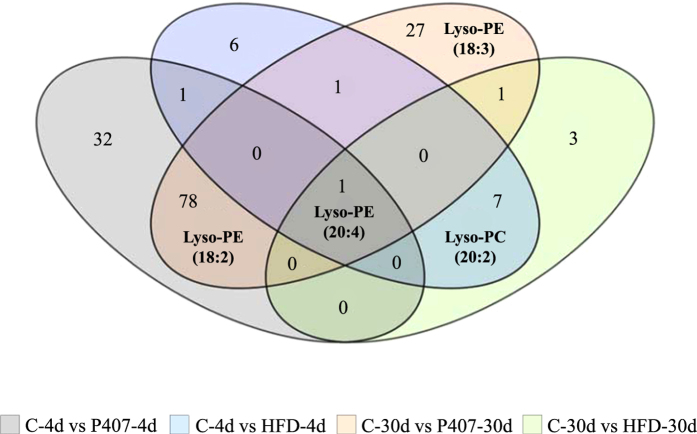
Figure 4.
Venn diagram displaying the implications of the identified circulating lyso forms in the four comparisons of interest. The statistical comparisons between the six groups (n = 9–10) were assessed using two- and one-way ANOVAs. The cut-off point for significance was p < 0.05 and for the two-way ANOVA, the p-value of the ‘intervention’ effect was calculated using the Benjamini-Hochberg correction. The figures indicate the number of significant metabolites for each comparison of interest, which were determined using Tukey’s post hoc test. Previously, the metabolites that exhibited significant changes among control groups (C-4d vs C-30d) were discarded. The areas where the ellipses overlap show the significant metabolites, particularly the Lyso-PLs, shared by the specific comparisons. Lyso-PE (20:4) was the only metabolite whose abundance was altered by both diet and the pro-dyslipidemic agent in the short- and long-term assessments.

