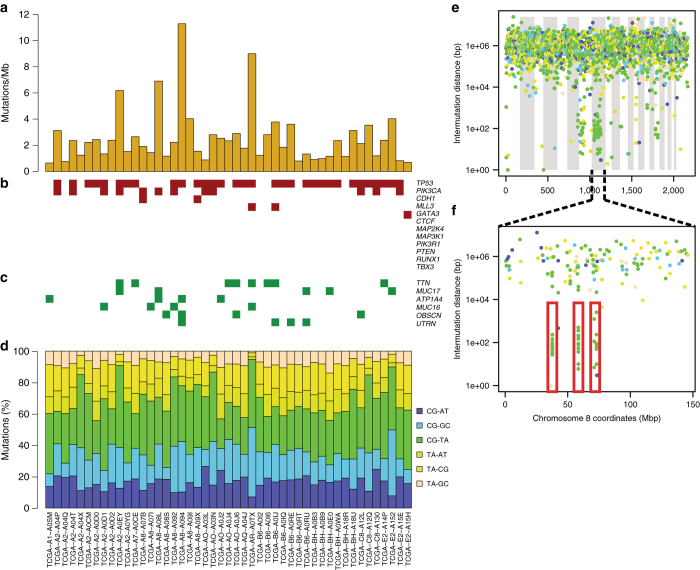
Fig. 1.
The 47 discovery breast tumors have typical mutational profiles. For each sample (sample IDs at bottom of panel 1D), we show a the number of mutations per Mb; b if a mutation is present in one of the 12 known breast cancer driver genes or c in non-driver genes that are mutated in at least 3 (8%) discovery samples; and d genome-wide SNV substitution frequencies; CG–TA mutations are the most common. e The mutational profile in discovery sample TCGA-A2-A0D1 (SNV substitution types colored-coded as in panel 1D). The X-axis shows all mutations ordered by mutation index (from the first mutated position on chromosome 1 to last mutated position on chromosome X) and the Y-axis represents the average distance between each mutation and its two neighboring mutations, in log-scale. f Shows three kataegis loci (red rectangles) on chromosome 8

