
Fig. 2.
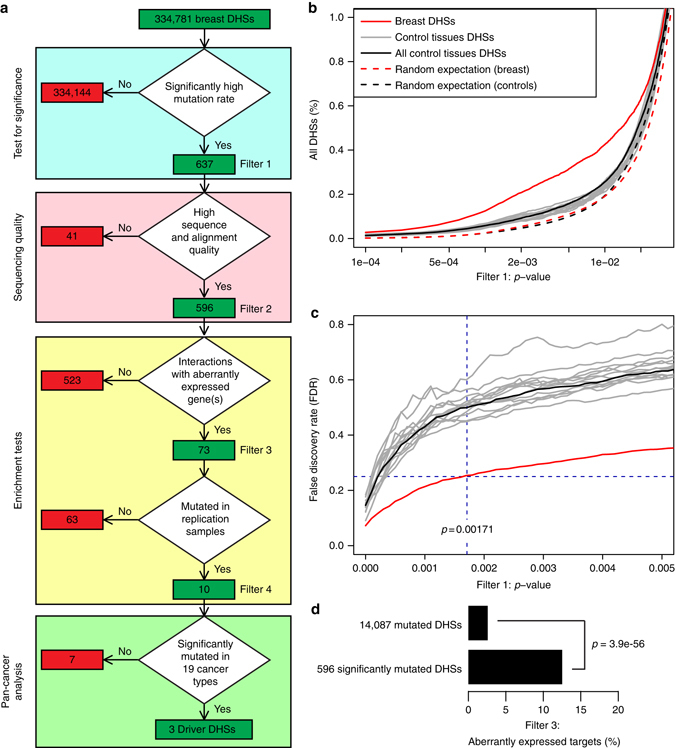
Identification of driver DHSs in breast cancer. a Analysis flowchart for identifying putative driver DHSs. The 334,781 breast DHSs were filtered consecutively for: (1) a significantly high mutation density (p < 0.00171, corresponding to FDR < 0.25, see Methods); (2) high sequence and alignment quality; (3) having a known target gene within 500 kb that is aberrantly expressed in breast tumors; (4) being mutated in two replication sets of breast cancer samples; and (5) being significantly mutated above background in a pan-cancer analysis. b Cumulative distributions of test statistic p used in Filter 1 that are <0.05 (log-scale) for: (1) breast DHSs; (2) the 13 control tissues DHSs (one gray line for each); (3) “All control tissues” DHSs represent the union of DHSs that are active in the 13 control tissues; (4) and (5) simulated mutations (random expectation) in breast and control tissues DHSs, respectively. (c) False discovery rate and p threshold. We set the threshold to a value p*, below which DHSs are considered significant, according to Eq. 4, limiting the expected false discovery rate to 0.25. We applied this FDR threshold to breast (red) as well as to each control tissue’s DHSs (gray) and all control tissues DHSs (representing the union of all control tissues DHSs, black). The vertical dashed line represents p* for breast DHSs (p* = 0.00171). d The 596 mutated DHSs passing Filter 2 are enriched for DHSs associated with target genes that are aberrantly expressed