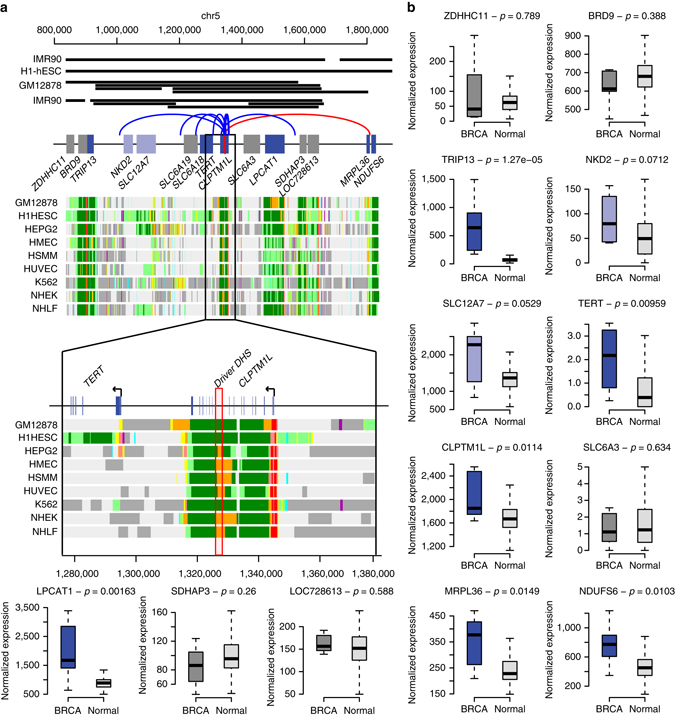
Fig. 4.

Mutations in putative driver DHS chr5:1325957-1328153 result in overexpression of six neighboring genes. Mutations in putative driver DHS chr5:1325957-1328153 result in overexpression of six neighboring genes. a The 1 Mb interval surrounding the putative driver DHS (red rectangle, lower panel), showing all genes that are expressed in breast cancer. Chromatin states of nine cell lines show that the DHS is an enhancer and that many of the genes in this interval are expressed across diverse tissue types (data derived from the Broad ChromHMM track in the UCSC genome browser70; light green = weakly transcribed; dark green = transcribed, orange = strong enhancers, yellow = weak enhancers, red = active promoters, light red = weak promoters, violet = inactive/poised promoters, blue = distal CTCF/insulators, dark gray = polycomb repressed, light gray = heterochromatin). Black lines show TADs detected in IMR90 and H1-hESC cell lines31, while gray lines show chromatin loops derived from IMR90 and GM12878 cell lines32. Curved lines show validated (blue) and predicted interactions (red) between the putative driver DHS and target genes25, 26. b Boxplots showing expression levels of 13 genes in the seven TCGA breast cancer samples (three discovery and four replication) that harbor mutations in the putative driver DHS (breast invasive carcinoma: BRCA) and in 106 unrelated normal TCGA breast tissues (normal). Significantly overexpressed genes (dark blue, p-value < 0.05) and those with a trend towards overexpression (light blue, p-value < 0.1) are indicated. p-values were calculated with Wilcoxon test. Boxplots were created with the boxplot function in R: center line represents the median value, box limits correspond to first and third quartile, while whiskers extend between the minimum and maximum value
