Fig. 6.
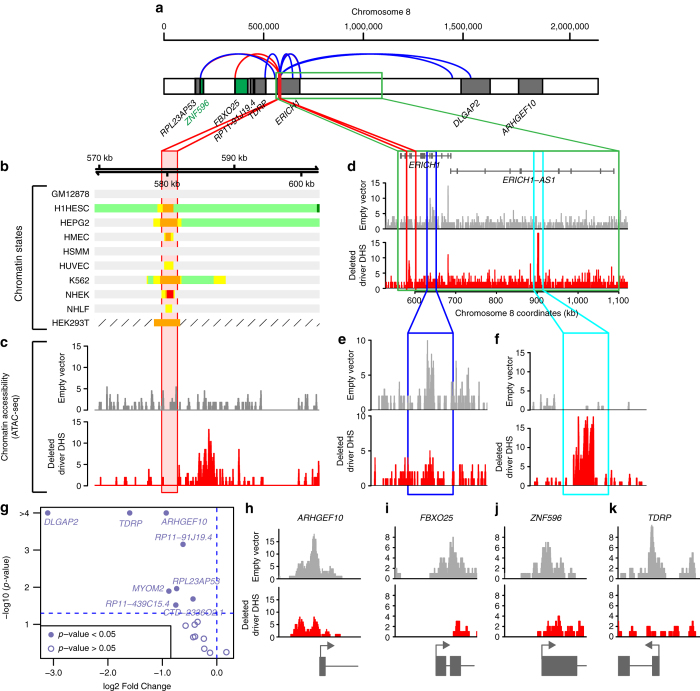
Deletion of putative driver DHS chr8:579137-581436 results in chromatin remodeling in the surrounding interval. a The relative positions of the deleted putative driver DHS (red) and the neighboring genes expressed in HEK293T are shown. ZNF596 (green) had altered expression associated with mutations and known interactions (Filter 3). Curved lines show validated (blue) and predicted interactions (red) between the driver DHS and putative target genes25, 26. b Chromatin states of HEK293T were derived from ChIP-seq data in the GEO series GSE5163361 and for the remaining cell lines from the Broad ChromHMM track in the UCSC genome browser70 (light green = weakly transcribed; dark green = transcribed, orange = strong enhancers, yellow = weak enhancers, red = active promoters, light red = weak promoters, violet = inactive/poised promoters, blue = distal CTCF/insulators, dark gray = polycomb repressed, light gray = heterochromatin, hatched box = missing data). c Show ATAC-seq data corresponding to deleted putative driver DHS (red) and HEK293T cell line treated with empty vector (gray). d–f The deletion of DHS chr8:579137-581436 (highlighted in red) results in the loss of an ATAC-seq peak (40 kb distal, dark blue square, shown in e) and the gain of an ATAC-seq peak (410 kb distal, light blue square, shown in f). g Volcano plot showing log2 fold change and p-value of gene expression differences (Wald test, computed using the DESeq function in R) between cells with deleted putative driver DHS and cells treated with empty vector. h–k Shown are ATAC-seq peaks in four genes that have alterations in chromatin accessibility at their promoters (indicated by arrow) when the putative driver DHS is deleted

