
Figure 2.
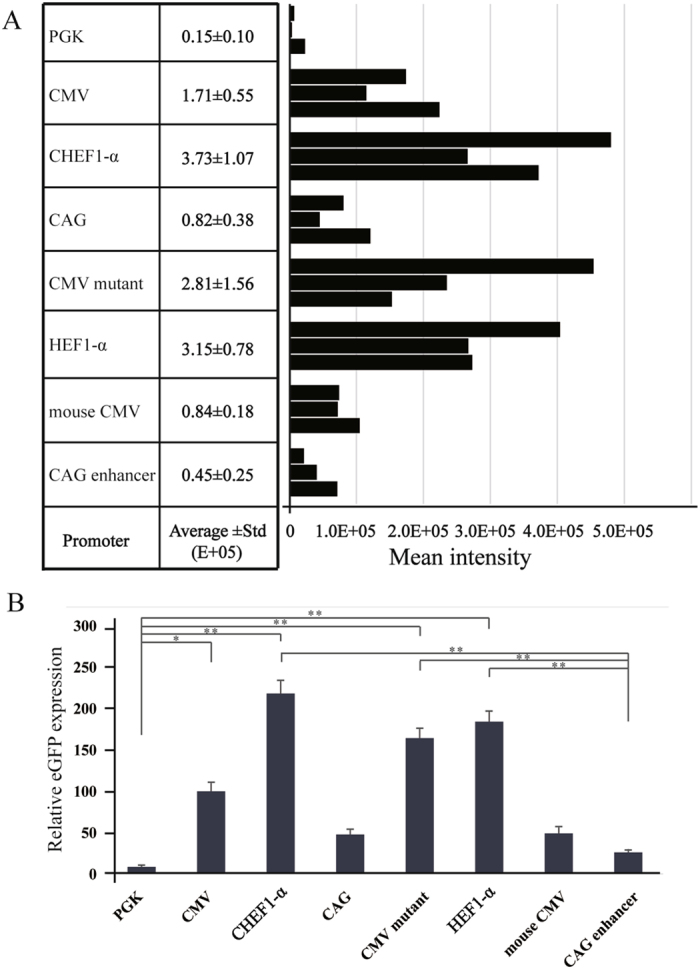
Cells were collected at 10 generation post-transfection and the eGFP MFI was measured by flow cytometry. (A) The stably transfected cells were screened in medium containing G418 (800 μg/mL). The eGFP MFI of stably transfected cell lines containing different promoters were detected. Black bar represent the results from after 10 generations analyzed by flow cytometry. (B) Fold statistical analysis results of expression level, and the eGFP MFI was normalized to CMV promoter. Three stably transfected pools were generated for each vector. Cells were collected and measured for the eGFP MFI with the FACS Calibur (*P < 0.05, **P < 0.01).