
FIGURE 1.
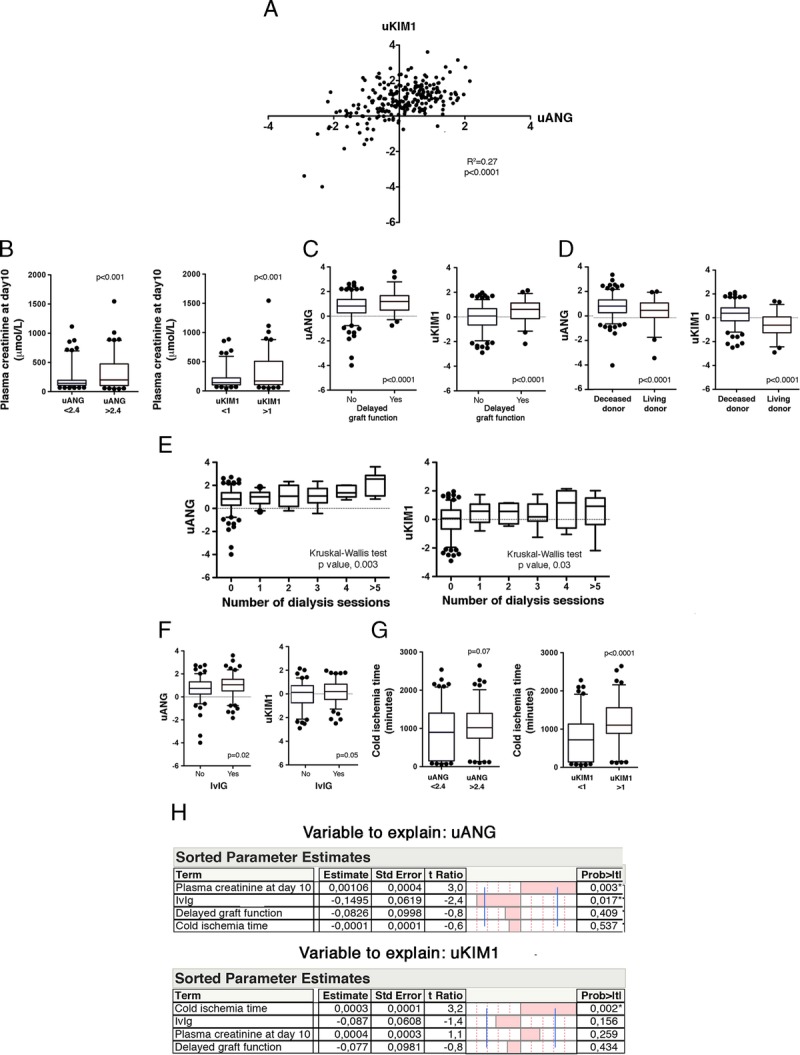
Biochemical characterization of urinary ANG. A, Scatter plot representing the bivariate fit of uKIM1 values by uANG values in this whole cohort (n = 244). B, Box and whiskers plots representing the distribution of plasma creatinine according to uANG and uKIM1 median, Student t test. C, Box and whiskers plots representing the distribution of uANG and uKIM median according to DGF, Student t test. D, Box and whiskers plots representing the distribution of uANG and uKIM according to the live status of the donor, Student t test. E, Box and whiskers plots representing the distribution of uANG and uKIM according to the number of dialysis sessions, Kruskal-Wallis test. F, Box and whiskers plots representing the distribution of uANG and uKIM according to IvIG use, Student t test. G, Box and whiskers plots representing the distribution of CIT according to uANG and uKIM1 median, Student t test. H, Multiple linear regression analysis (standard least squares model) between uKIM (up) and uANG (down) and CIT, IvIG induction (no), plasma creatinine and DGF (no). Estimate values give the estimate of the model coefficients for each term. The t ratio is the ratio of the estimate to its standard error and tests whether the true value of the parameter is zero.