
FIGURE 6.
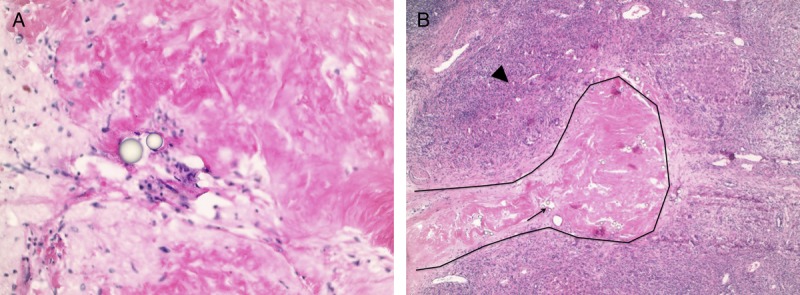
Histological examination of the treated lesions. Case 1 slides (A), hematoxylin-eosin stain (40×) demonstrates an area of fibrosis inside the tumor bed with glass beads (arrow). Case 2 slides (B), hematoxylin-eosin stain (10×) demonstrates a fibrotic portal vein (black contour) with glass beads inside the vessel lumen (arrow). The surrounding parenchyma is fibrotic.