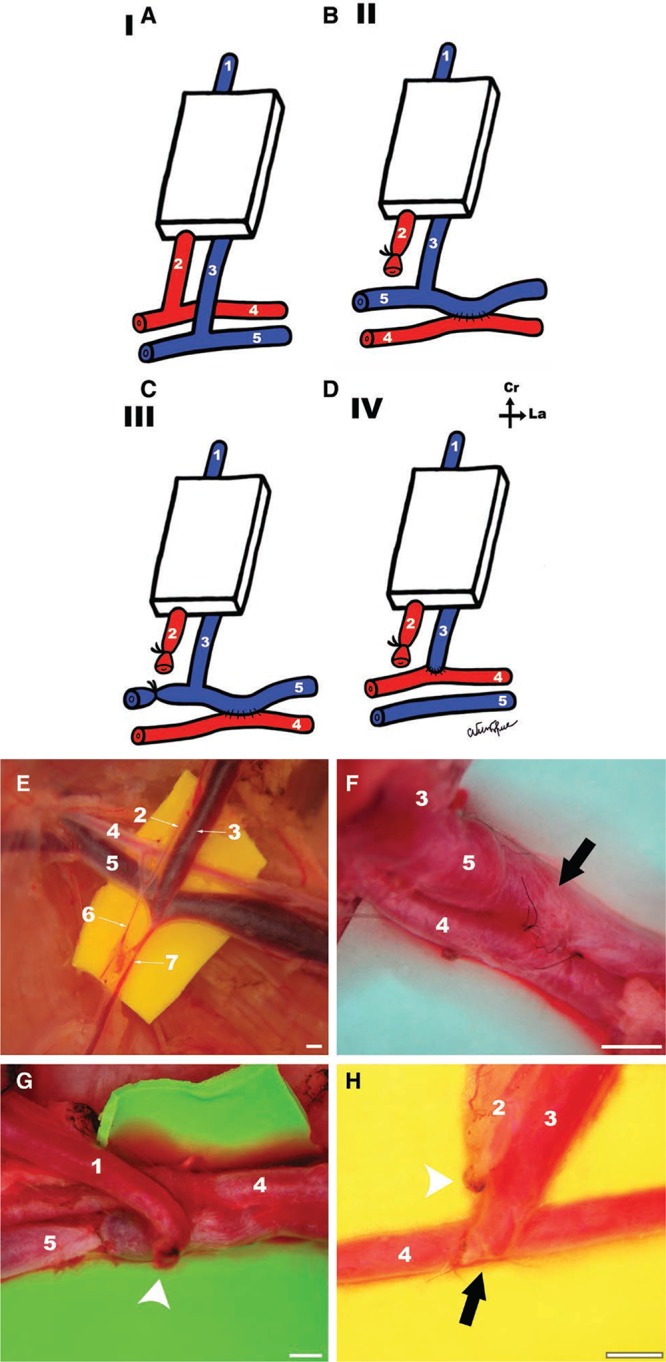
Fig. 2.

A,B,C,D, Schematic representation of the vascular patterns in the different experimental groups. A, Group I (CPF). B, Group II (AVF produced by femoral side-to-side anastomosis). C, Group III (AVF produced by femoral side-to-side anastomosis and proximal ligation of the femoral vein). D, Group IV (AVF produced by terminal-lateral anastomosis of the epigastric vein to the femoral artery). Cr, cranial; La, lateral. E, F, G, H, Surgical operating view of the inflow vessels of the flap in groups I, II, III, and IV, respectively. Arrows indicate place of arteriovenous anastomosis. Arrow heads indicate vessel ligation. Calibration bar = 1 mm.
