Fig. 3.

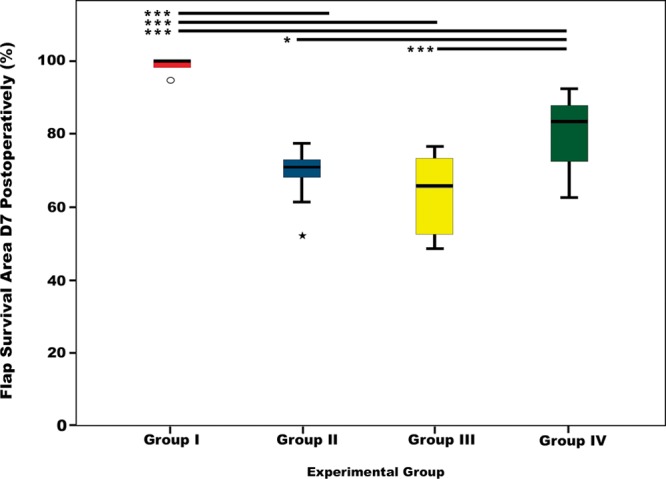
Box plots graphics illustrating flap survival in the different experimental groups 7 days postoperatively. Horizontal lines over boxplots indicate statistically significant differences. *P < 0.05; **P < 0.01; ***P < 0.001.

Box plots graphics illustrating flap survival in the different experimental groups 7 days postoperatively. Horizontal lines over boxplots indicate statistically significant differences. *P < 0.05; **P < 0.01; ***P < 0.001.