
Figure 2.
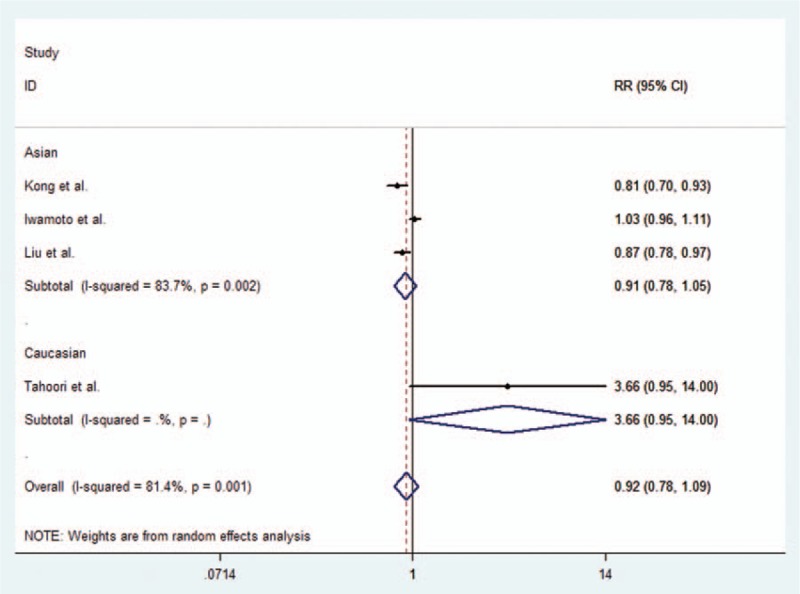
Forest plot describing the association between rs36084323 (PD-1.1 G/A) polymorphism and RA risk under the allele contrast model (A vs G).
Official websites use .gov
A
.gov website belongs to an official
government organization in the United States.
Secure .gov websites use HTTPS
A lock (
) or https:// means you've safely
connected to the .gov website. Share sensitive
information only on official, secure websites.
Forest plot describing the association between rs36084323 (PD-1.1 G/A) polymorphism and RA risk under the allele contrast model (A vs G).