Figure 3.

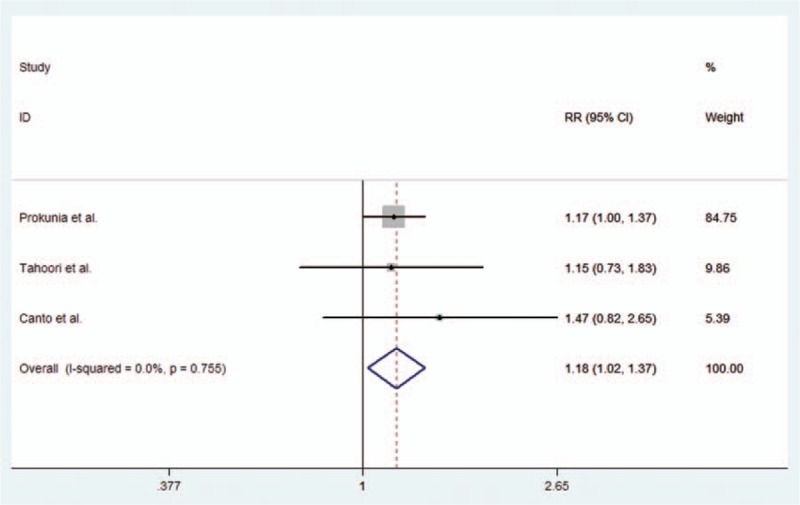
Forest plot describing the association between rs11568821 (PD-1.3 G/A) polymorphism and RA risk under the allele contrast model (A vs G).

Forest plot describing the association between rs11568821 (PD-1.3 G/A) polymorphism and RA risk under the allele contrast model (A vs G).