
Figure 11.
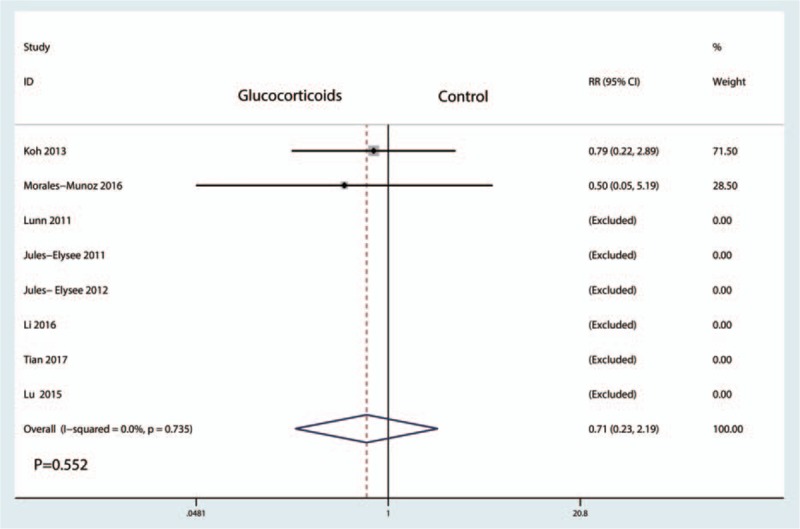
Forest plot comparing the incidence of infection between the between glucocorticoids group and control group.
Official websites use .gov
A
.gov website belongs to an official
government organization in the United States.
Secure .gov websites use HTTPS
A lock (
) or https:// means you've safely
connected to the .gov website. Share sensitive
information only on official, secure websites.
Forest plot comparing the incidence of infection between the between glucocorticoids group and control group.