
Figure 5.
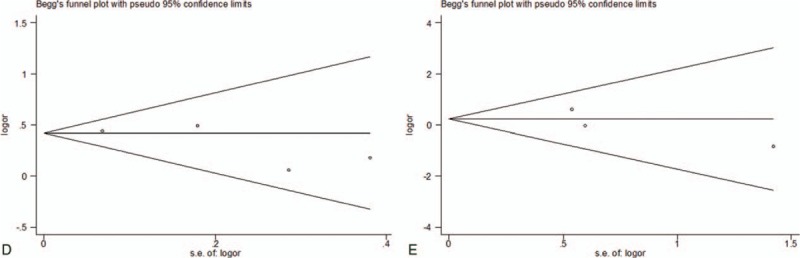
Funnel plot analysis of (D). Begg correlation test (P = .308) and Egger test (P = .286). Funnel plot analysis of (E). Begg correlation test (P = .296) and Egger test (P = .429).
Official websites use .gov
A
.gov website belongs to an official
government organization in the United States.
Secure .gov websites use HTTPS
A lock (
) or https:// means you've safely
connected to the .gov website. Share sensitive
information only on official, secure websites.
Funnel plot analysis of (D). Begg correlation test (P = .308) and Egger test (P = .286). Funnel plot analysis of (E). Begg correlation test (P = .296) and Egger test (P = .429).