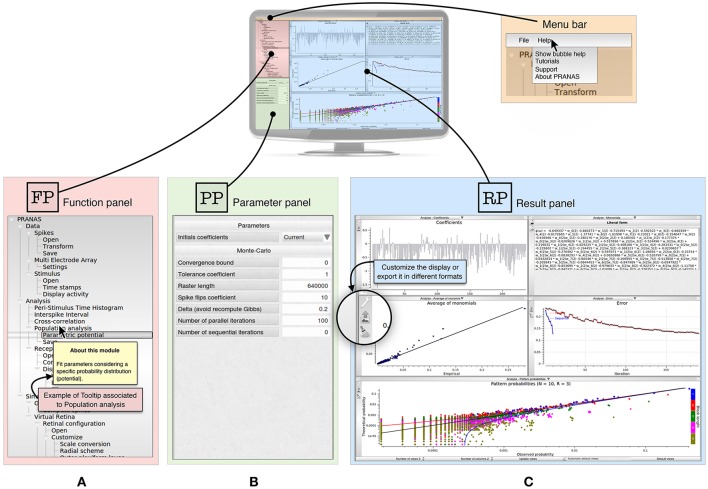
Figure 1.
Presentation of PRANAS GUI panels. (A) Function panel ( ) is the main panel containing Input/Output interfaces and functions. It is organized in three sections: Data, Analysis and Simulation. Note that in the Help option from the menu bar users can select Show bubble help which will trigger tooltips giving information for each function. (B) Depending on the function selected, the parameter panel (
 ) gives the opportunity to set the corresponding parameters. (C) Result panel (
 ) can show all results the user want. The number of sub-panels and the windows to show can be changed. Note that for each result shown in a sub-panel, the user can customize the display or export it in different formats.

