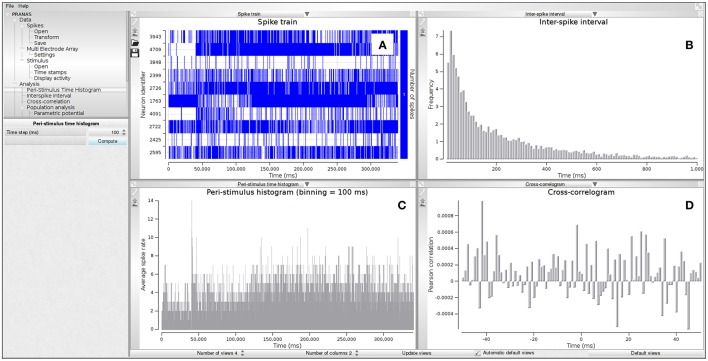
Figure 2.
Example of classical analysis for a spike train shown in sub-panel (A). The following estimations are shown: (B) Inter-spike interval (ISI), (C) Peri-stimulus time histogram (PSTH) and (D) cross-correlogram. Data from electrode array recording of a mouse retina in response to a moving pattern.

