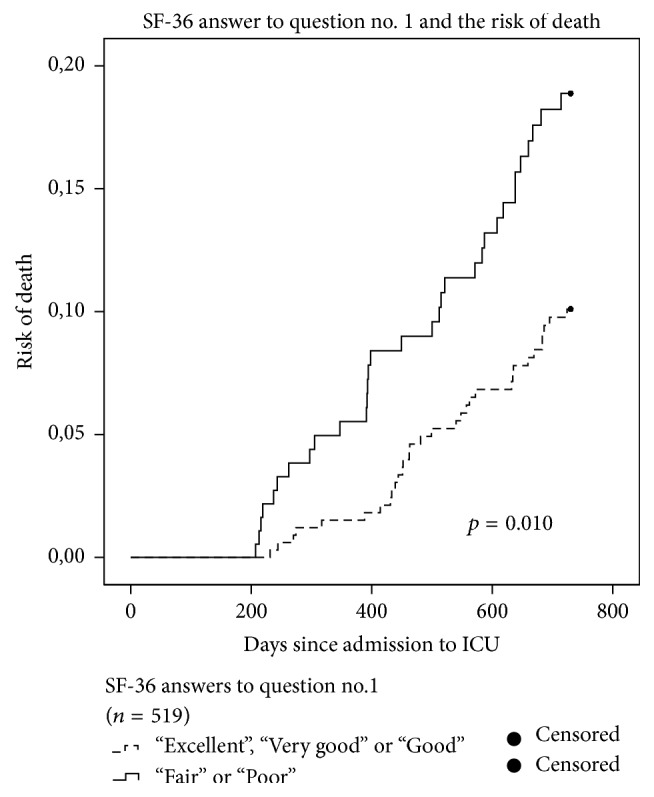
Figure 2.

Kaplan-Meier hazard curves for all patients (n = 519). Answers to SF-36 self-rated health item: “in general how would you say your health is?” The dashed line represents risk of death for the low-risk-group (answers: “Excellent,” “Very Good,” or “Good”). The fully drawn line is the risk of death for the high-risk- group (Answers: “Fair” or “Poor”).
