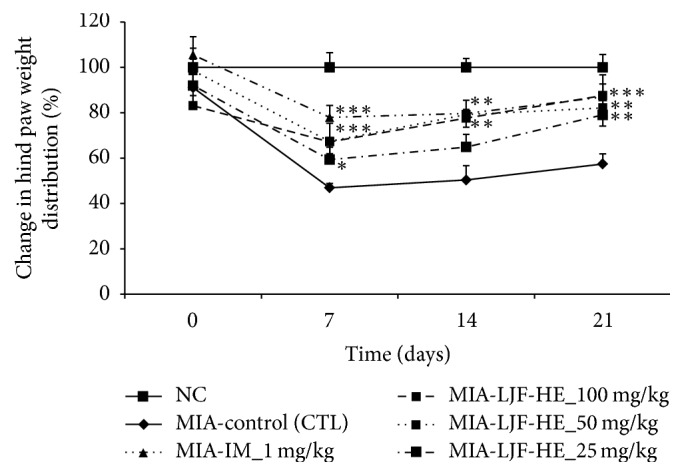
Figure 2.

Changes in hind paw weight-bearing distribution in rats with MIA-induced OA. Changes in hind paw weight-bearing distribution was measured once a week for three weeks after the injection with MIA. ∗ indicates p < 0.05, ∗∗ indicates p < 0.01, and ∗∗∗ indicates p < 0.001 when compared to the control group.
